
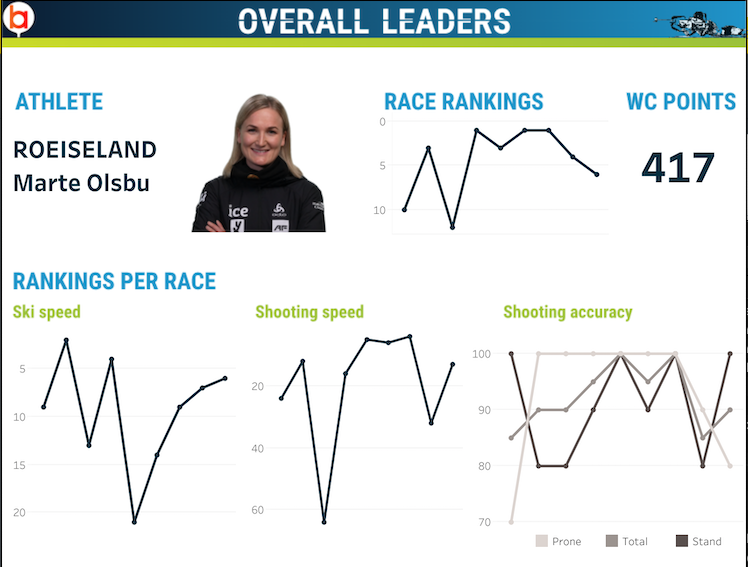
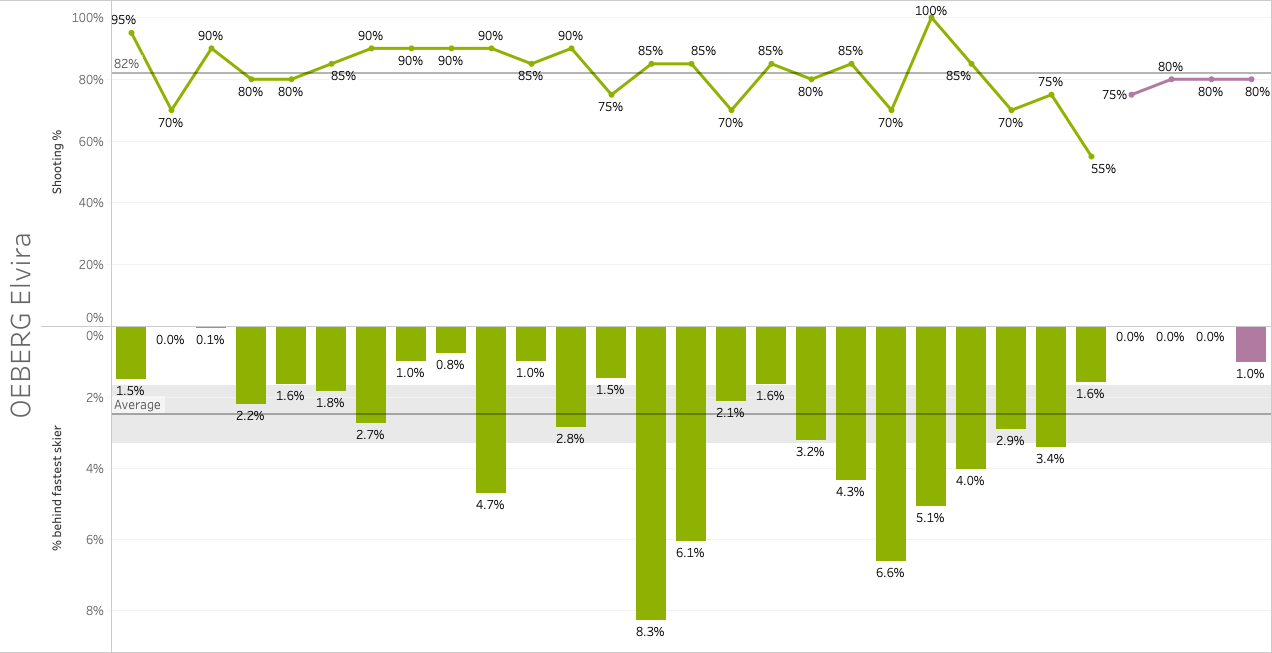
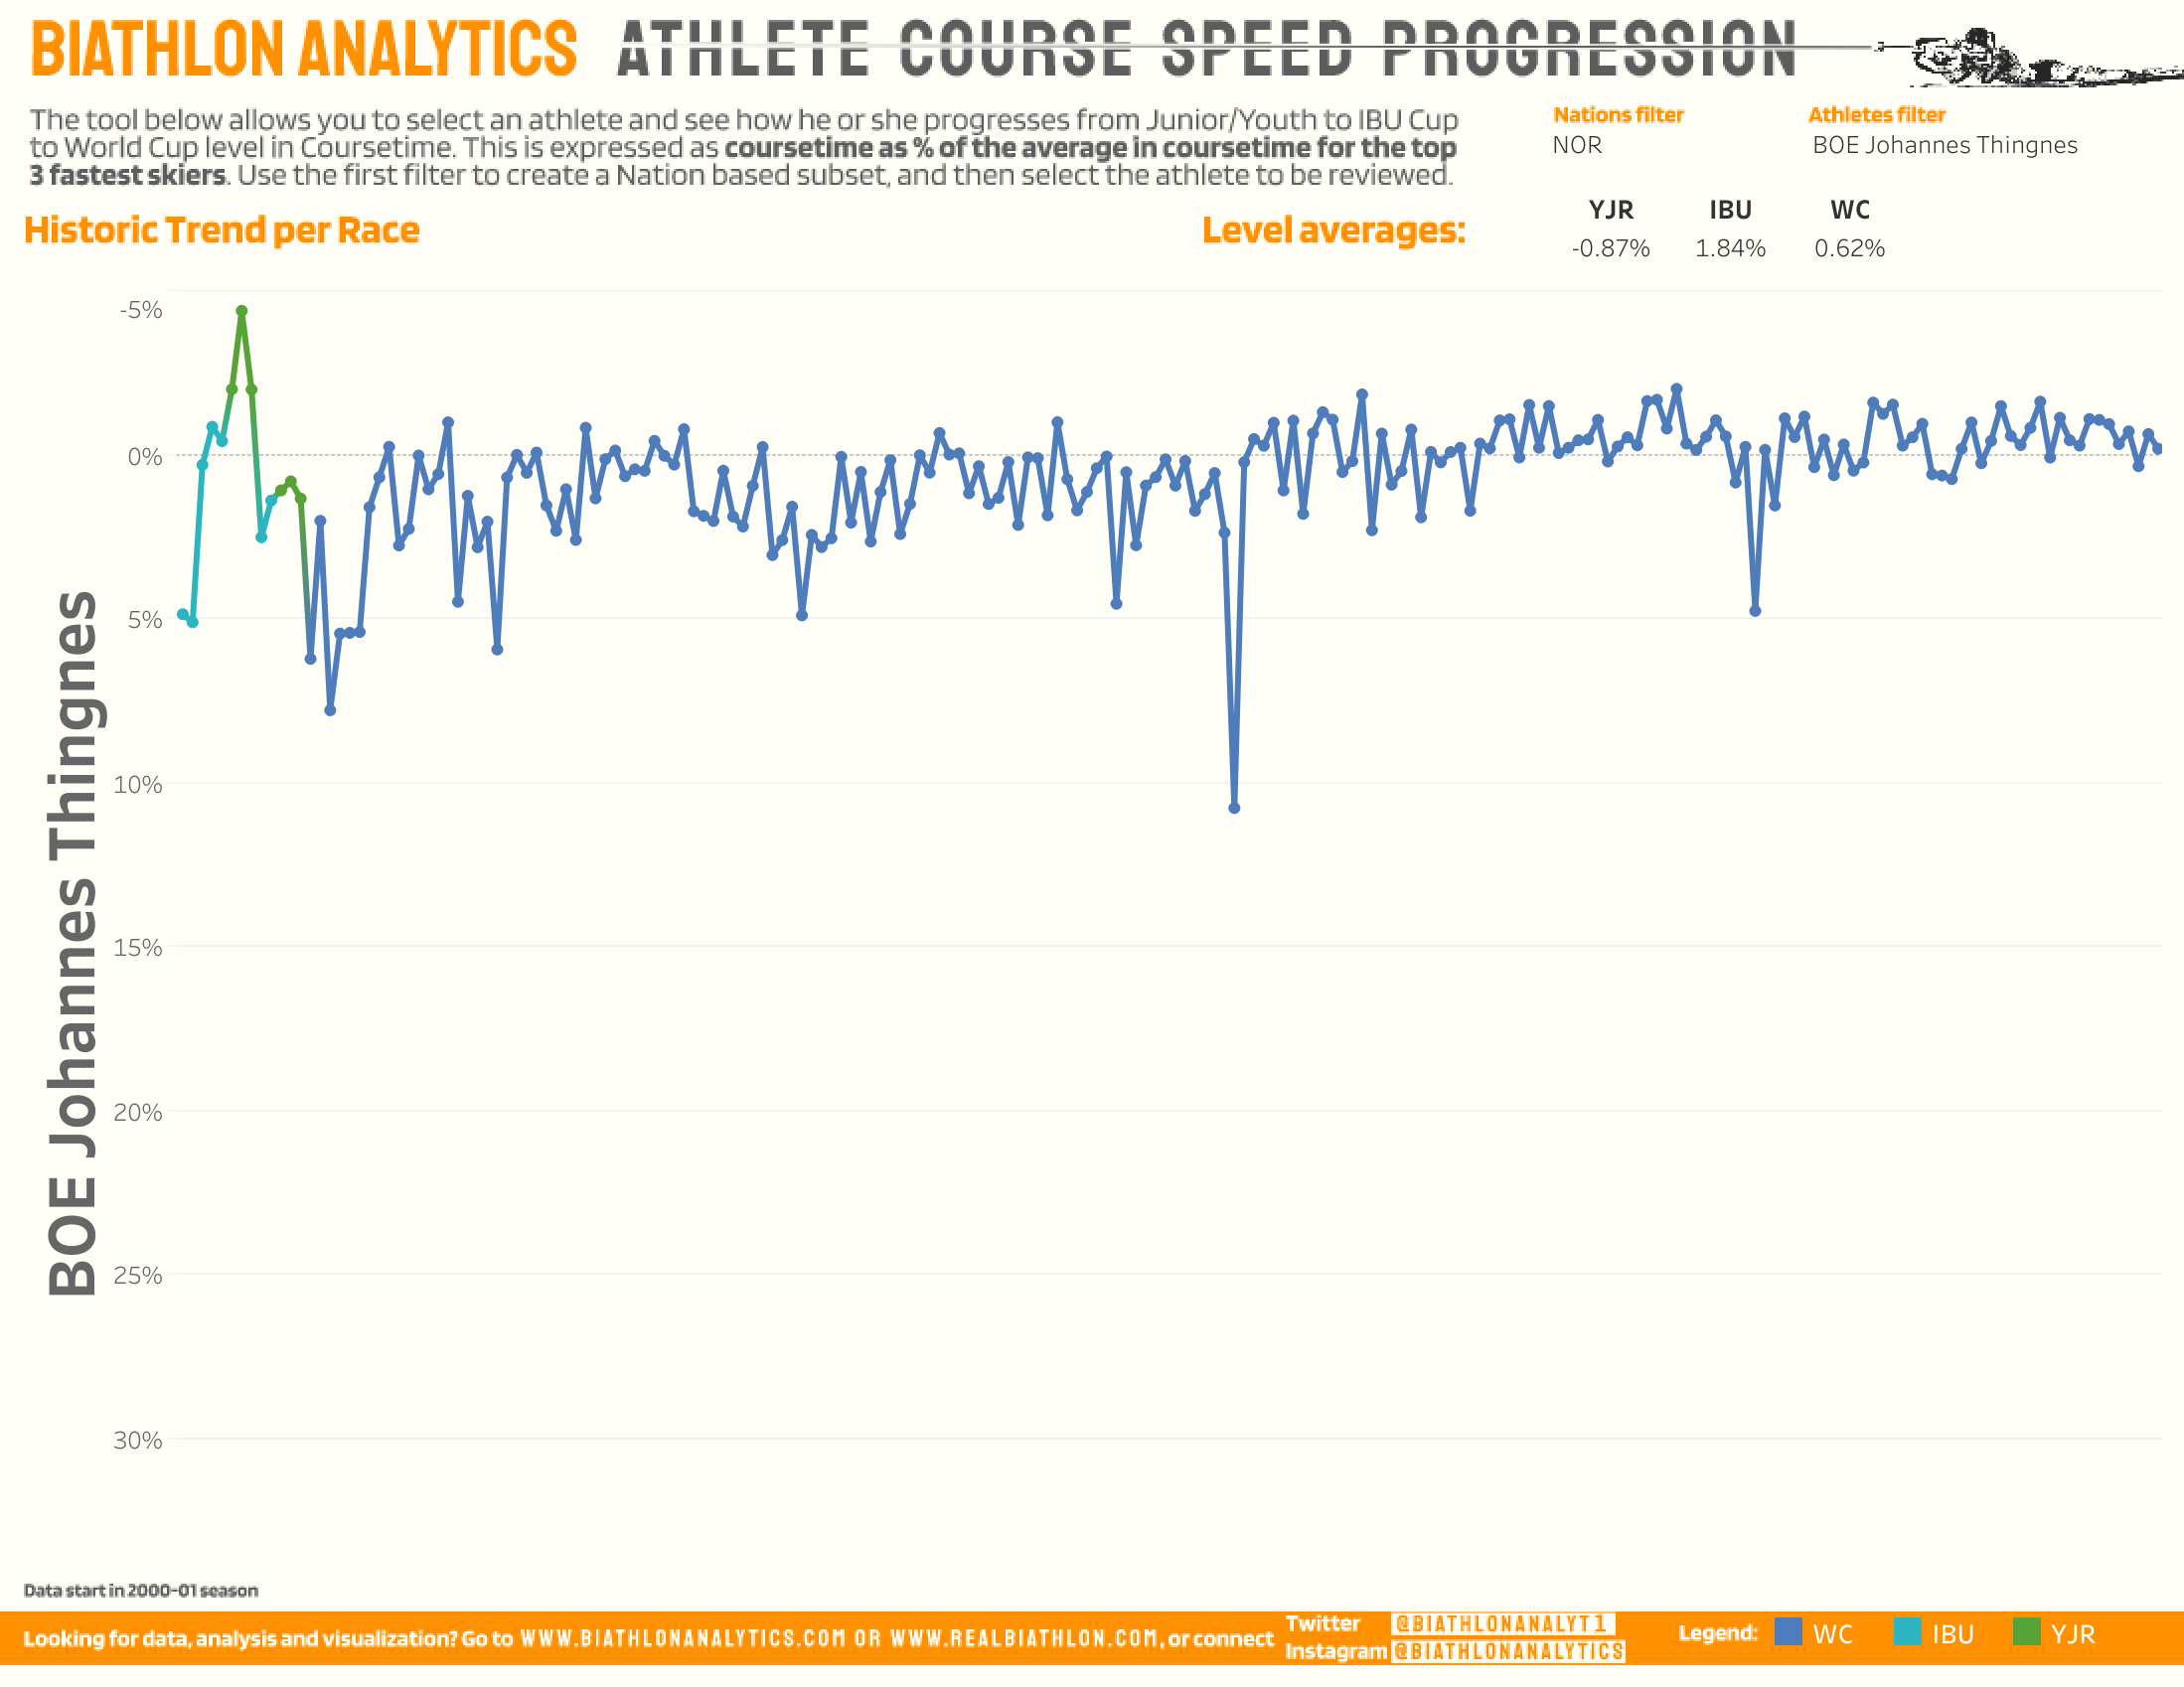
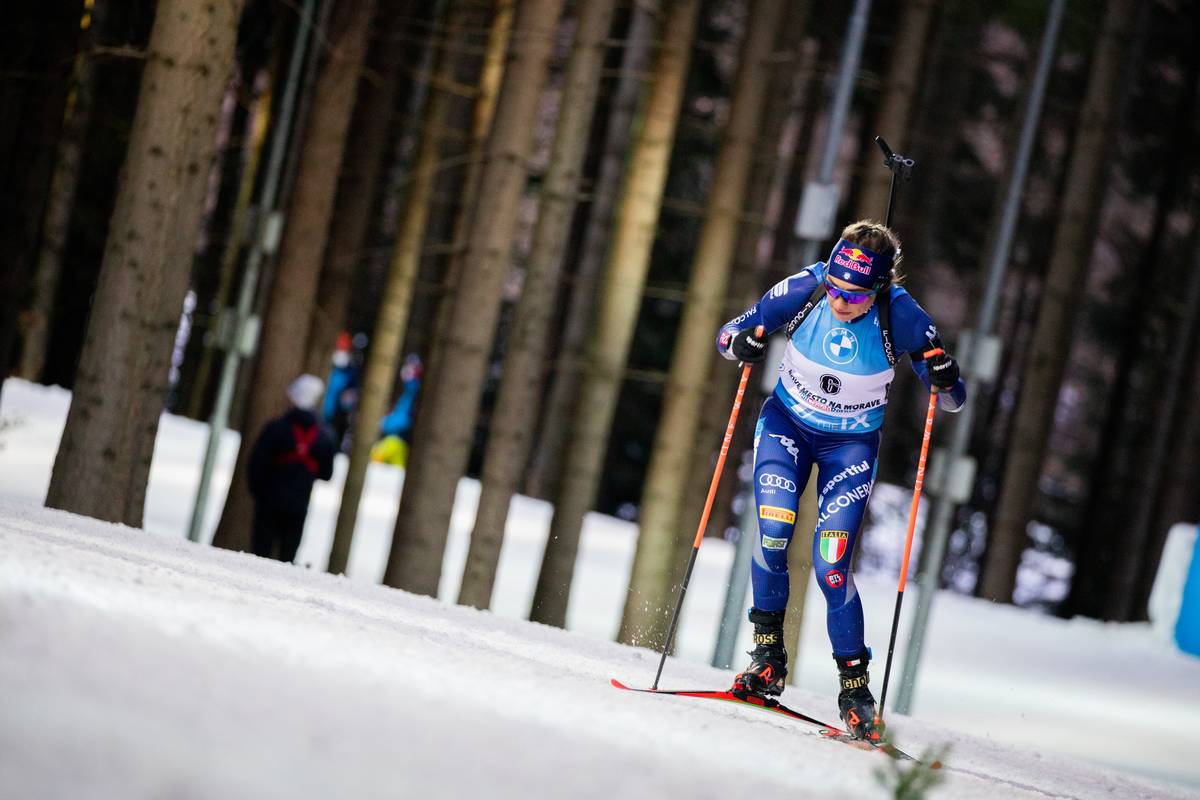
- Athlete analysis (3)
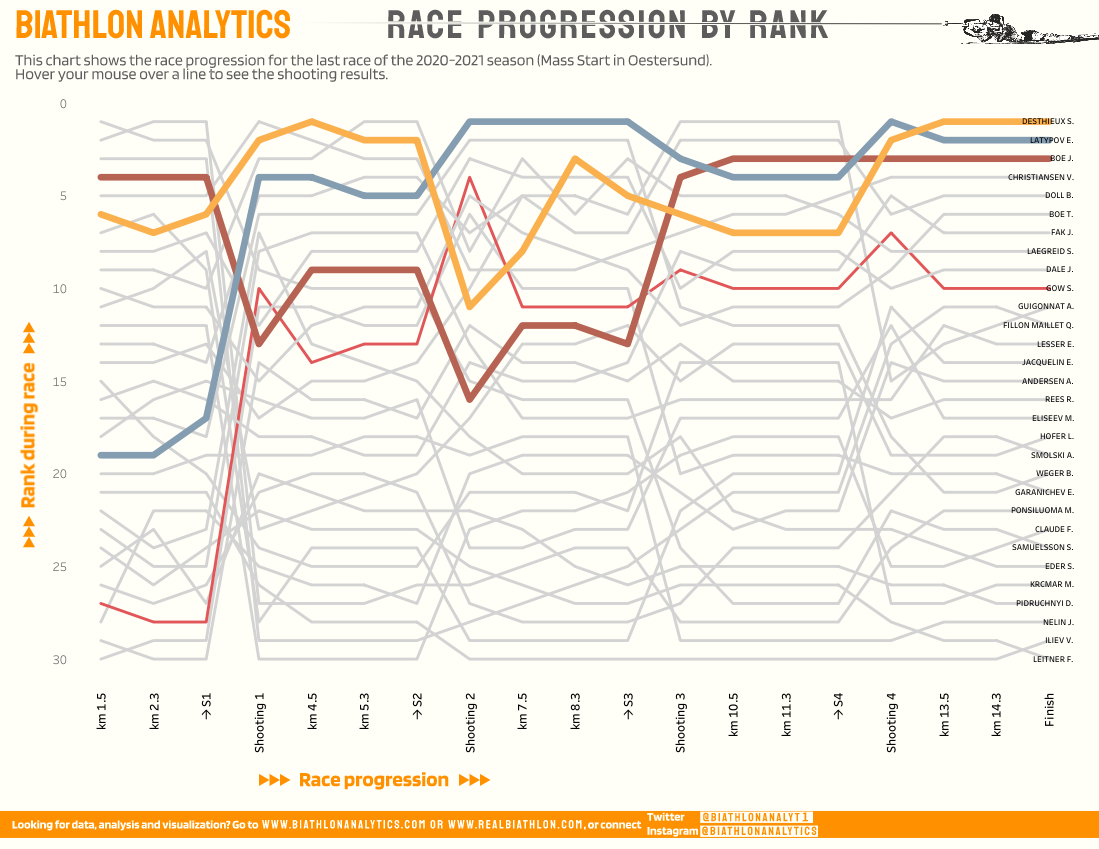
- Biathlon Analytics (58)
- Canada (3)
- Comic (1)
- Fun ideas (1)
- IBU Insider (3)
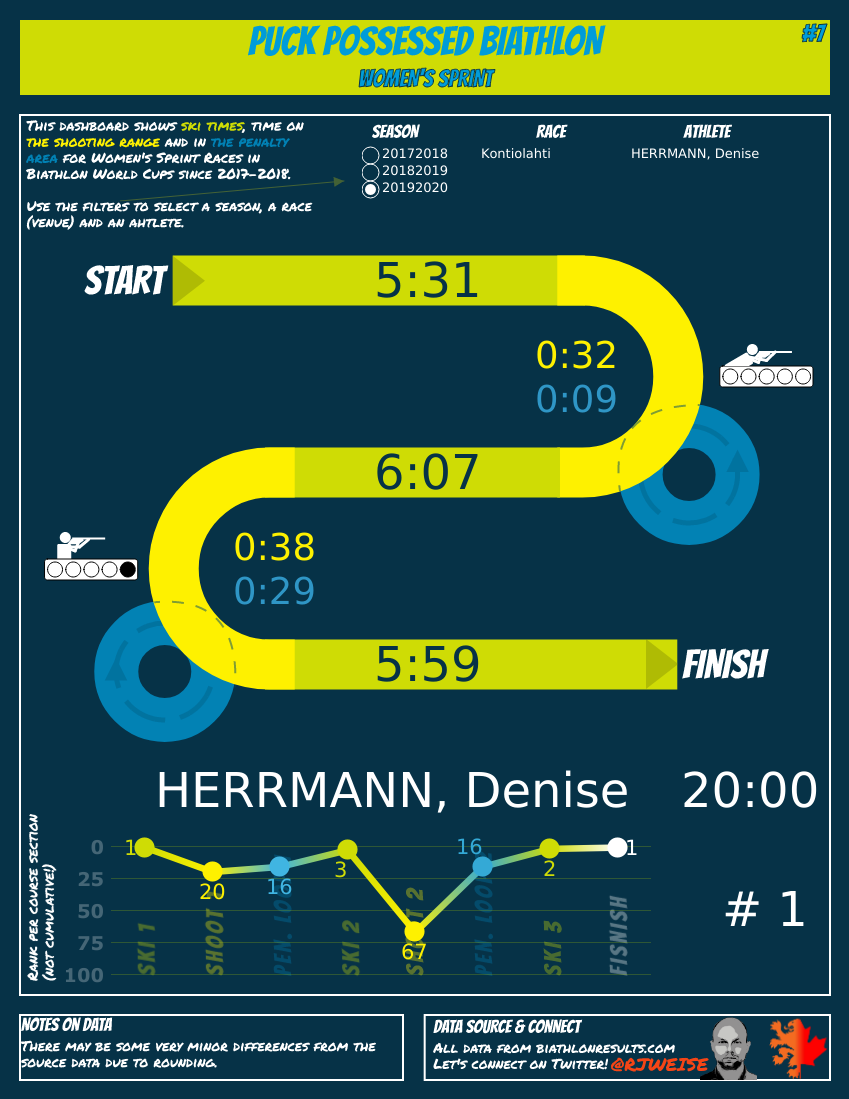
- Puck Possessed Biathlon (21)
- Puck Possessed Hockey (14)
- Statistical analysis (55)
- Uncategorized (1)
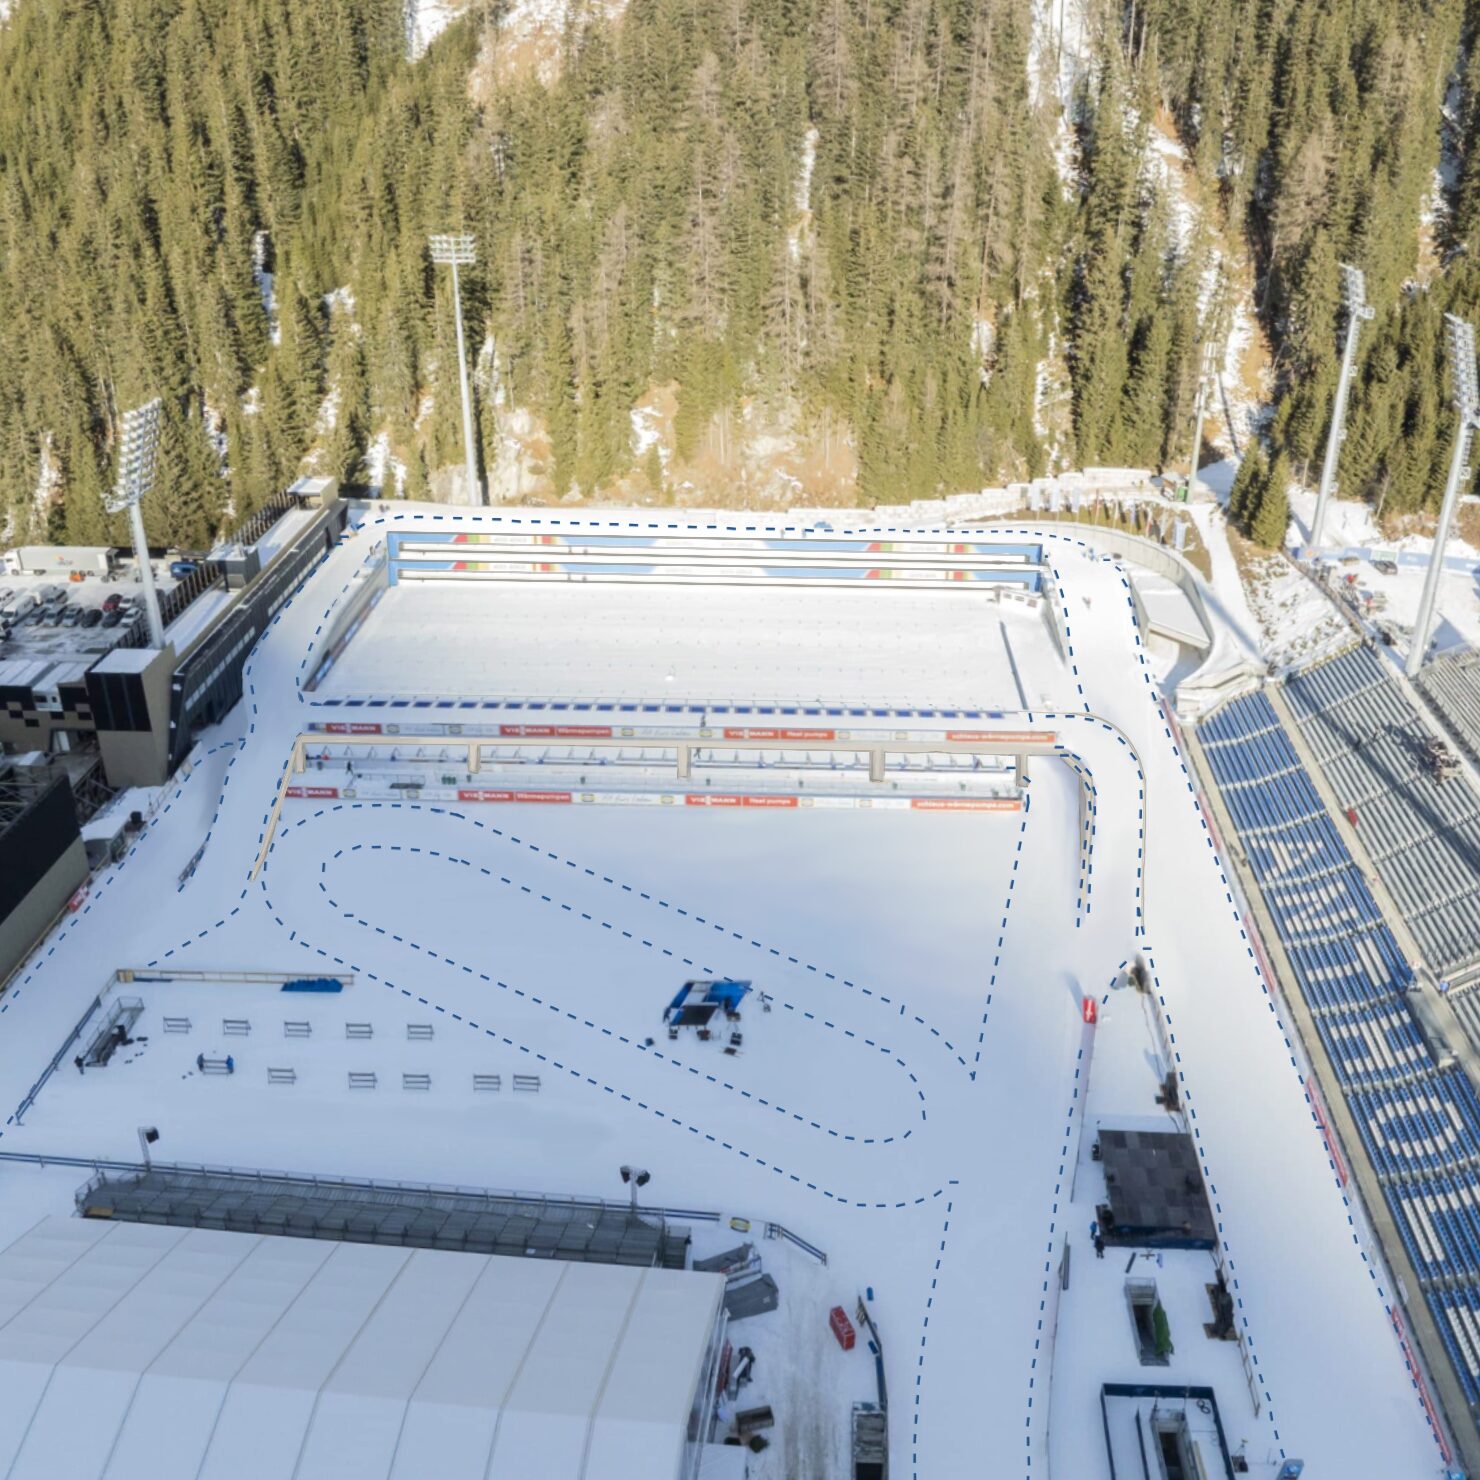
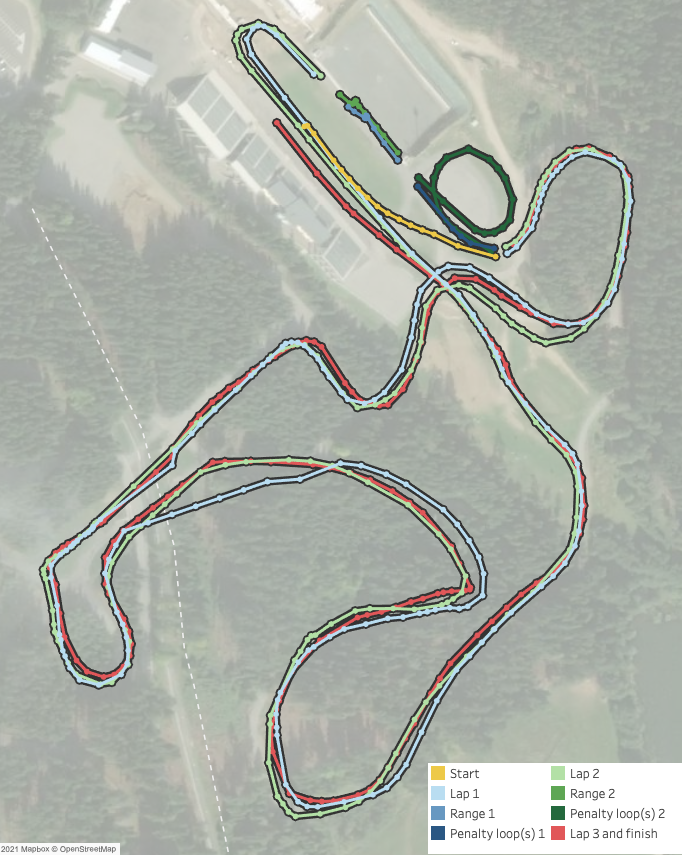
3D model of the Antholz Biathlon arena
With the Olympics in Italy, Antholz was chosen as the venue for the biathlon events. What set out as a simple idea turned into a crazy amount of “work” to create a 3D modelled environment of the venue that can be used for animations. Although not completely new to Blender, an incredible tool for 3D modelling, animation, and manny more things, turning the real world into a 3D modelled environment was a bit beyond my less than a year experience with the tool. But in the end I’m very happy with the final result. (sorry, I’m unable to embed for some…
One Track, Two Levels: Imagining the Future of Biathlon races.
For decades we have seen them. To accommodate growing numbers of golfers yet limited space, driving ranges have gone vertical. Adding one, or sometimes two, layers of hitting spots, the capacity doubles without increasing the footprint of the building. Moore Park Golf, Sydney, from freegolftracker.com So why do we still only have 30 racers in the Mass Starts, and 60 in the Pursuit? The Mass Start 60 is being “tested” on the IBU Cup, and it’s great that the IBU is looking into opening this race up for more competitors. But the one part that makes the Mass Start so…
Standings Isolated Pursuit 2024-2025 season
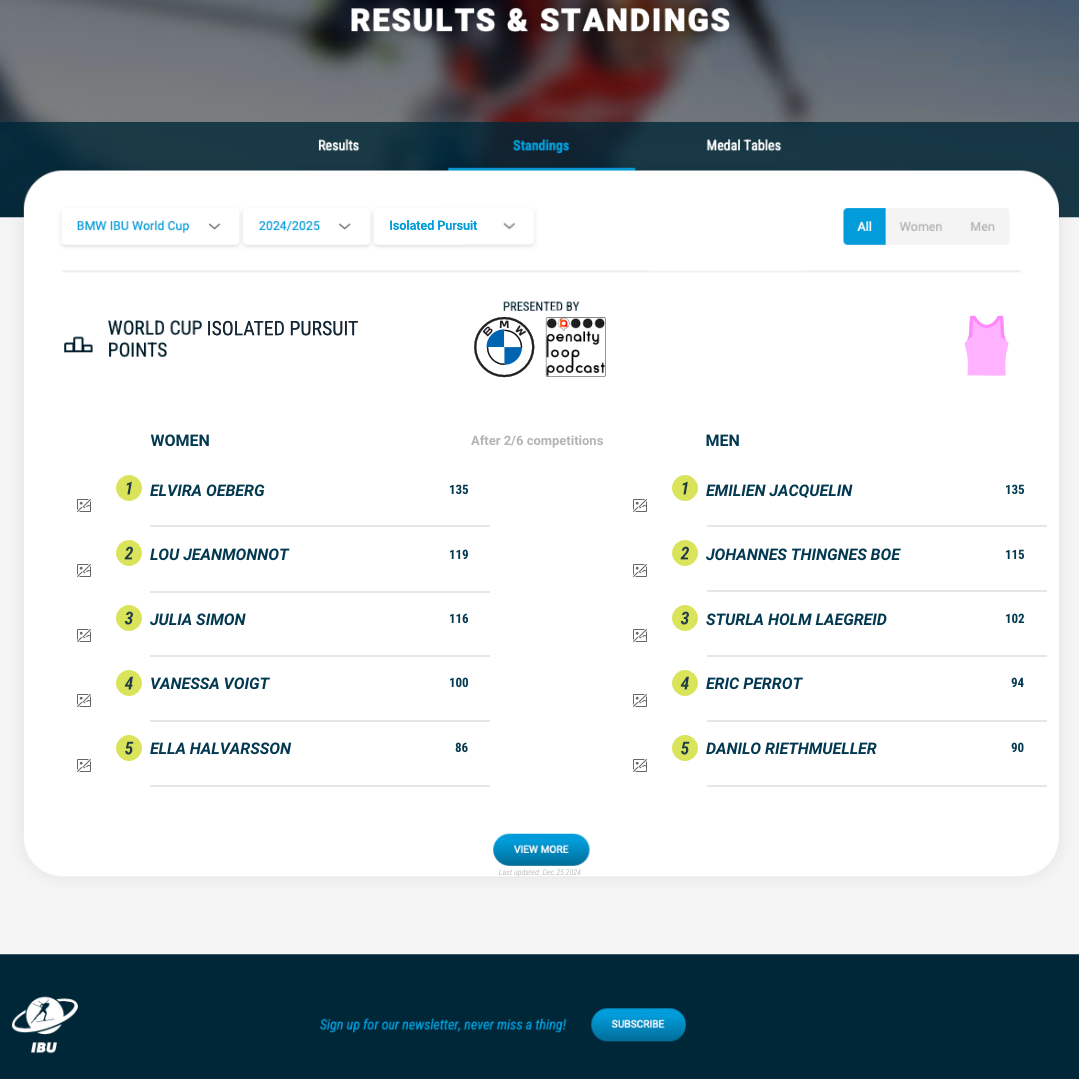
Updated March 9, 2025 Screenshot To see the latest updated version of the Standings, just go to my Tableau Public page directly.
From a Swedish hotel room to insight in sector times
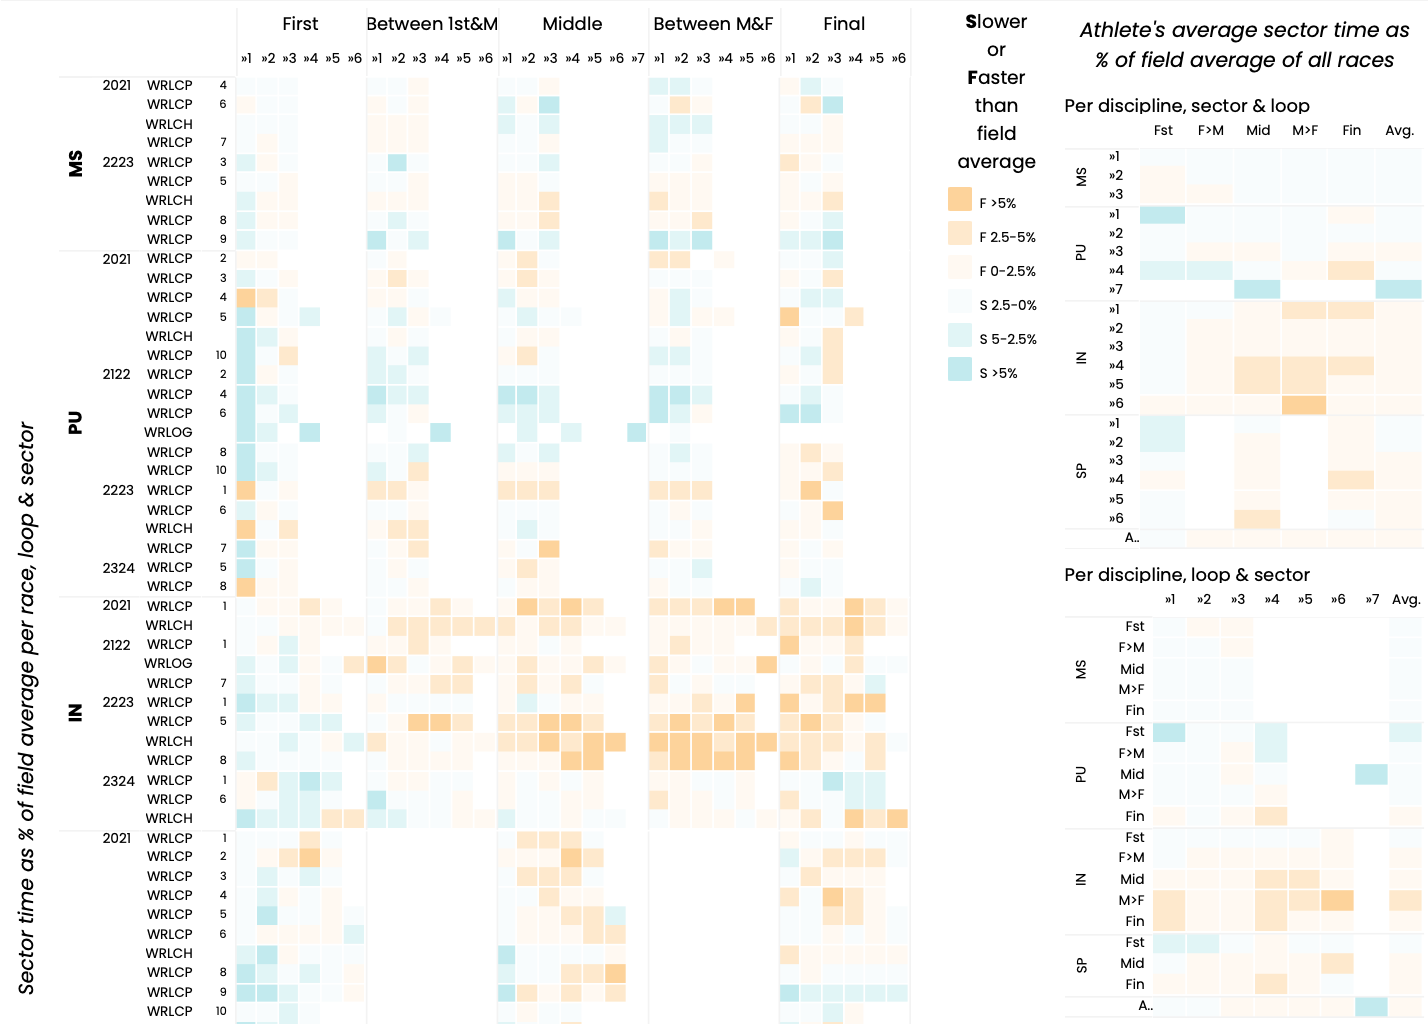
An analysis of skiing times per loop and sector in biathlon races.
Shooting Streak Dashboard Update
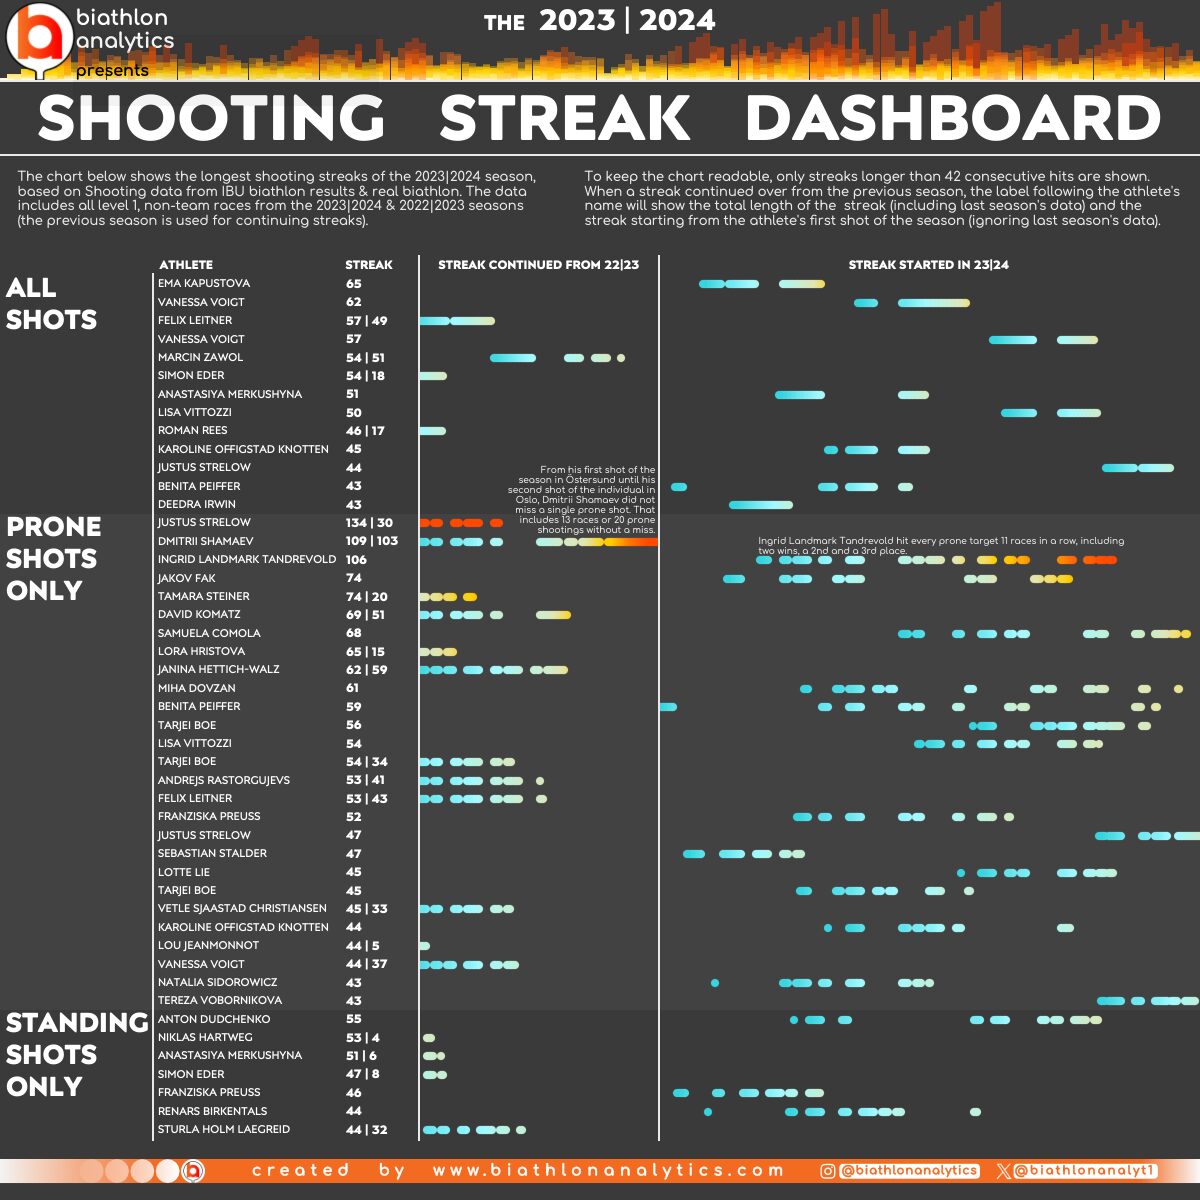
I updated the shooting streak dashboard with the 2023-2024 season data. 1 – Shooting time in seconds behind field average Highlights Ingrid Landmark Tandrevold had the longest streak of the season, with 106 prone shots in a row without a miss. The streak went from 12 December 2023 until 2 March 2024 spread over 13 races. During the streak she went clean on 19 consecutive prone shootings, and had 11 races in a row without a miss in prone. We also saw Justus Strelow’s streak of 134 prone shots come to an end, and Dmitrii Shamaev had a streak of…
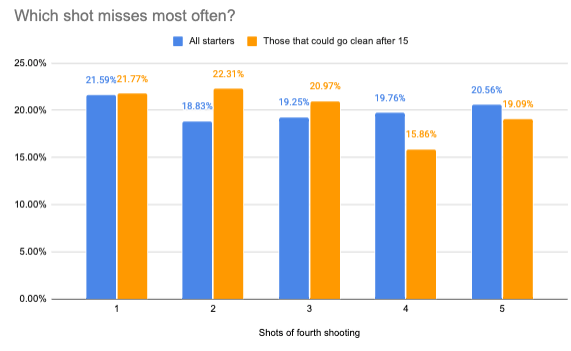
Shooting for nothing but gold. An analysis of the thrilling high risk – high reward shooting style of Emilien Jacquelin
A thorough analysis of Emilien Jacquelin’s shooting in biathlon
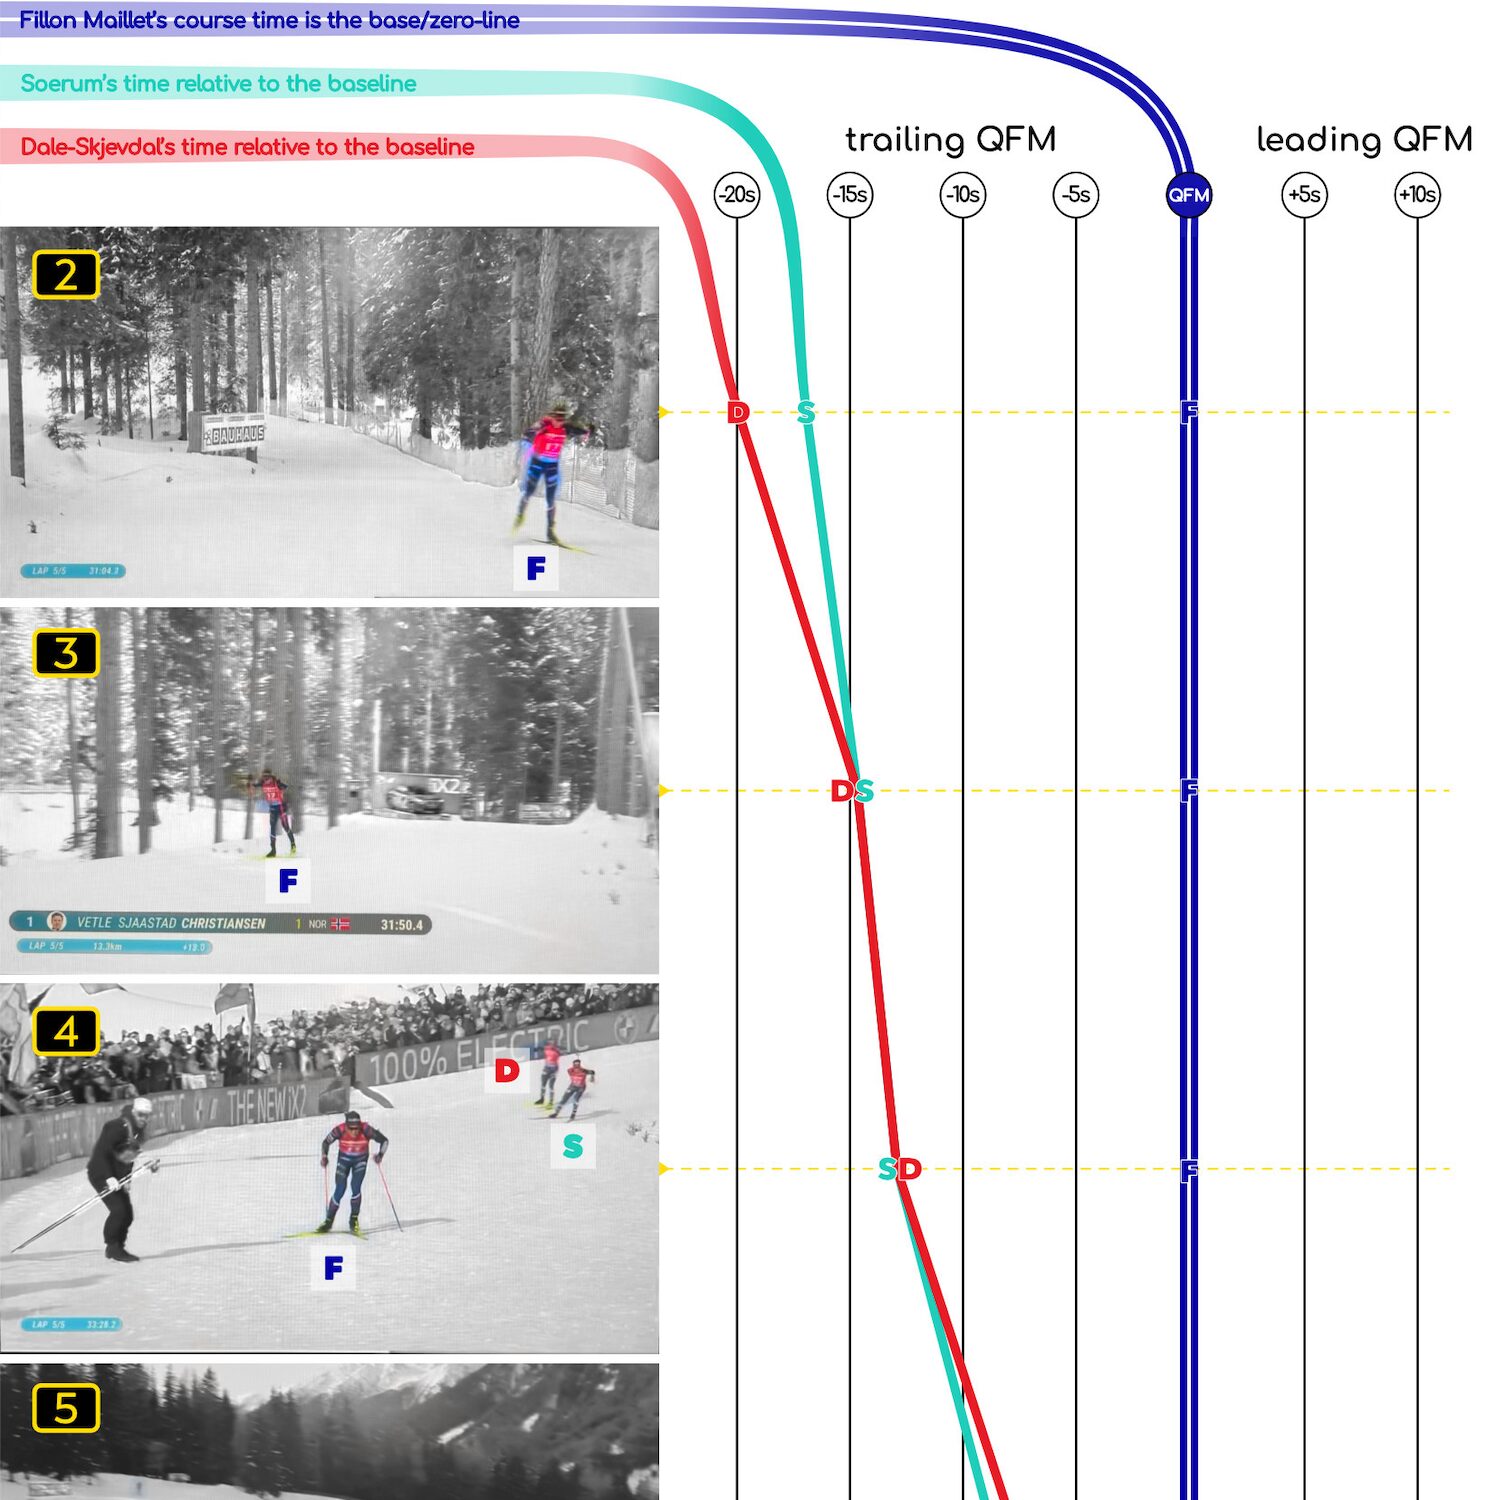
The ultimate review of the biathlon season for wax-amateurs.
Think of the men’s mass start in Antholz. Vetle Christiansen leaves the range after the final shooting with a large-enough lead to be confident he’s going to win. QFM is in second place, and he also should be confident about getting the silver. But Dale and Soerum put in a monster ski performance (or did they?) QFM’s on the other hand struggles with the wax and perhaps also his fitness. The ease with which the two Norwegians close in on the Frenchman, particularly on the downhill sections, is shockingly noticeable. In the snapshots below, Dale makes up an estimated 57m…
Getting the wax right
Download the visual below, Getting The Wax Right, in full resolution PDF formatDownload Getting the wax right
How old is too old for an Olympic medal?
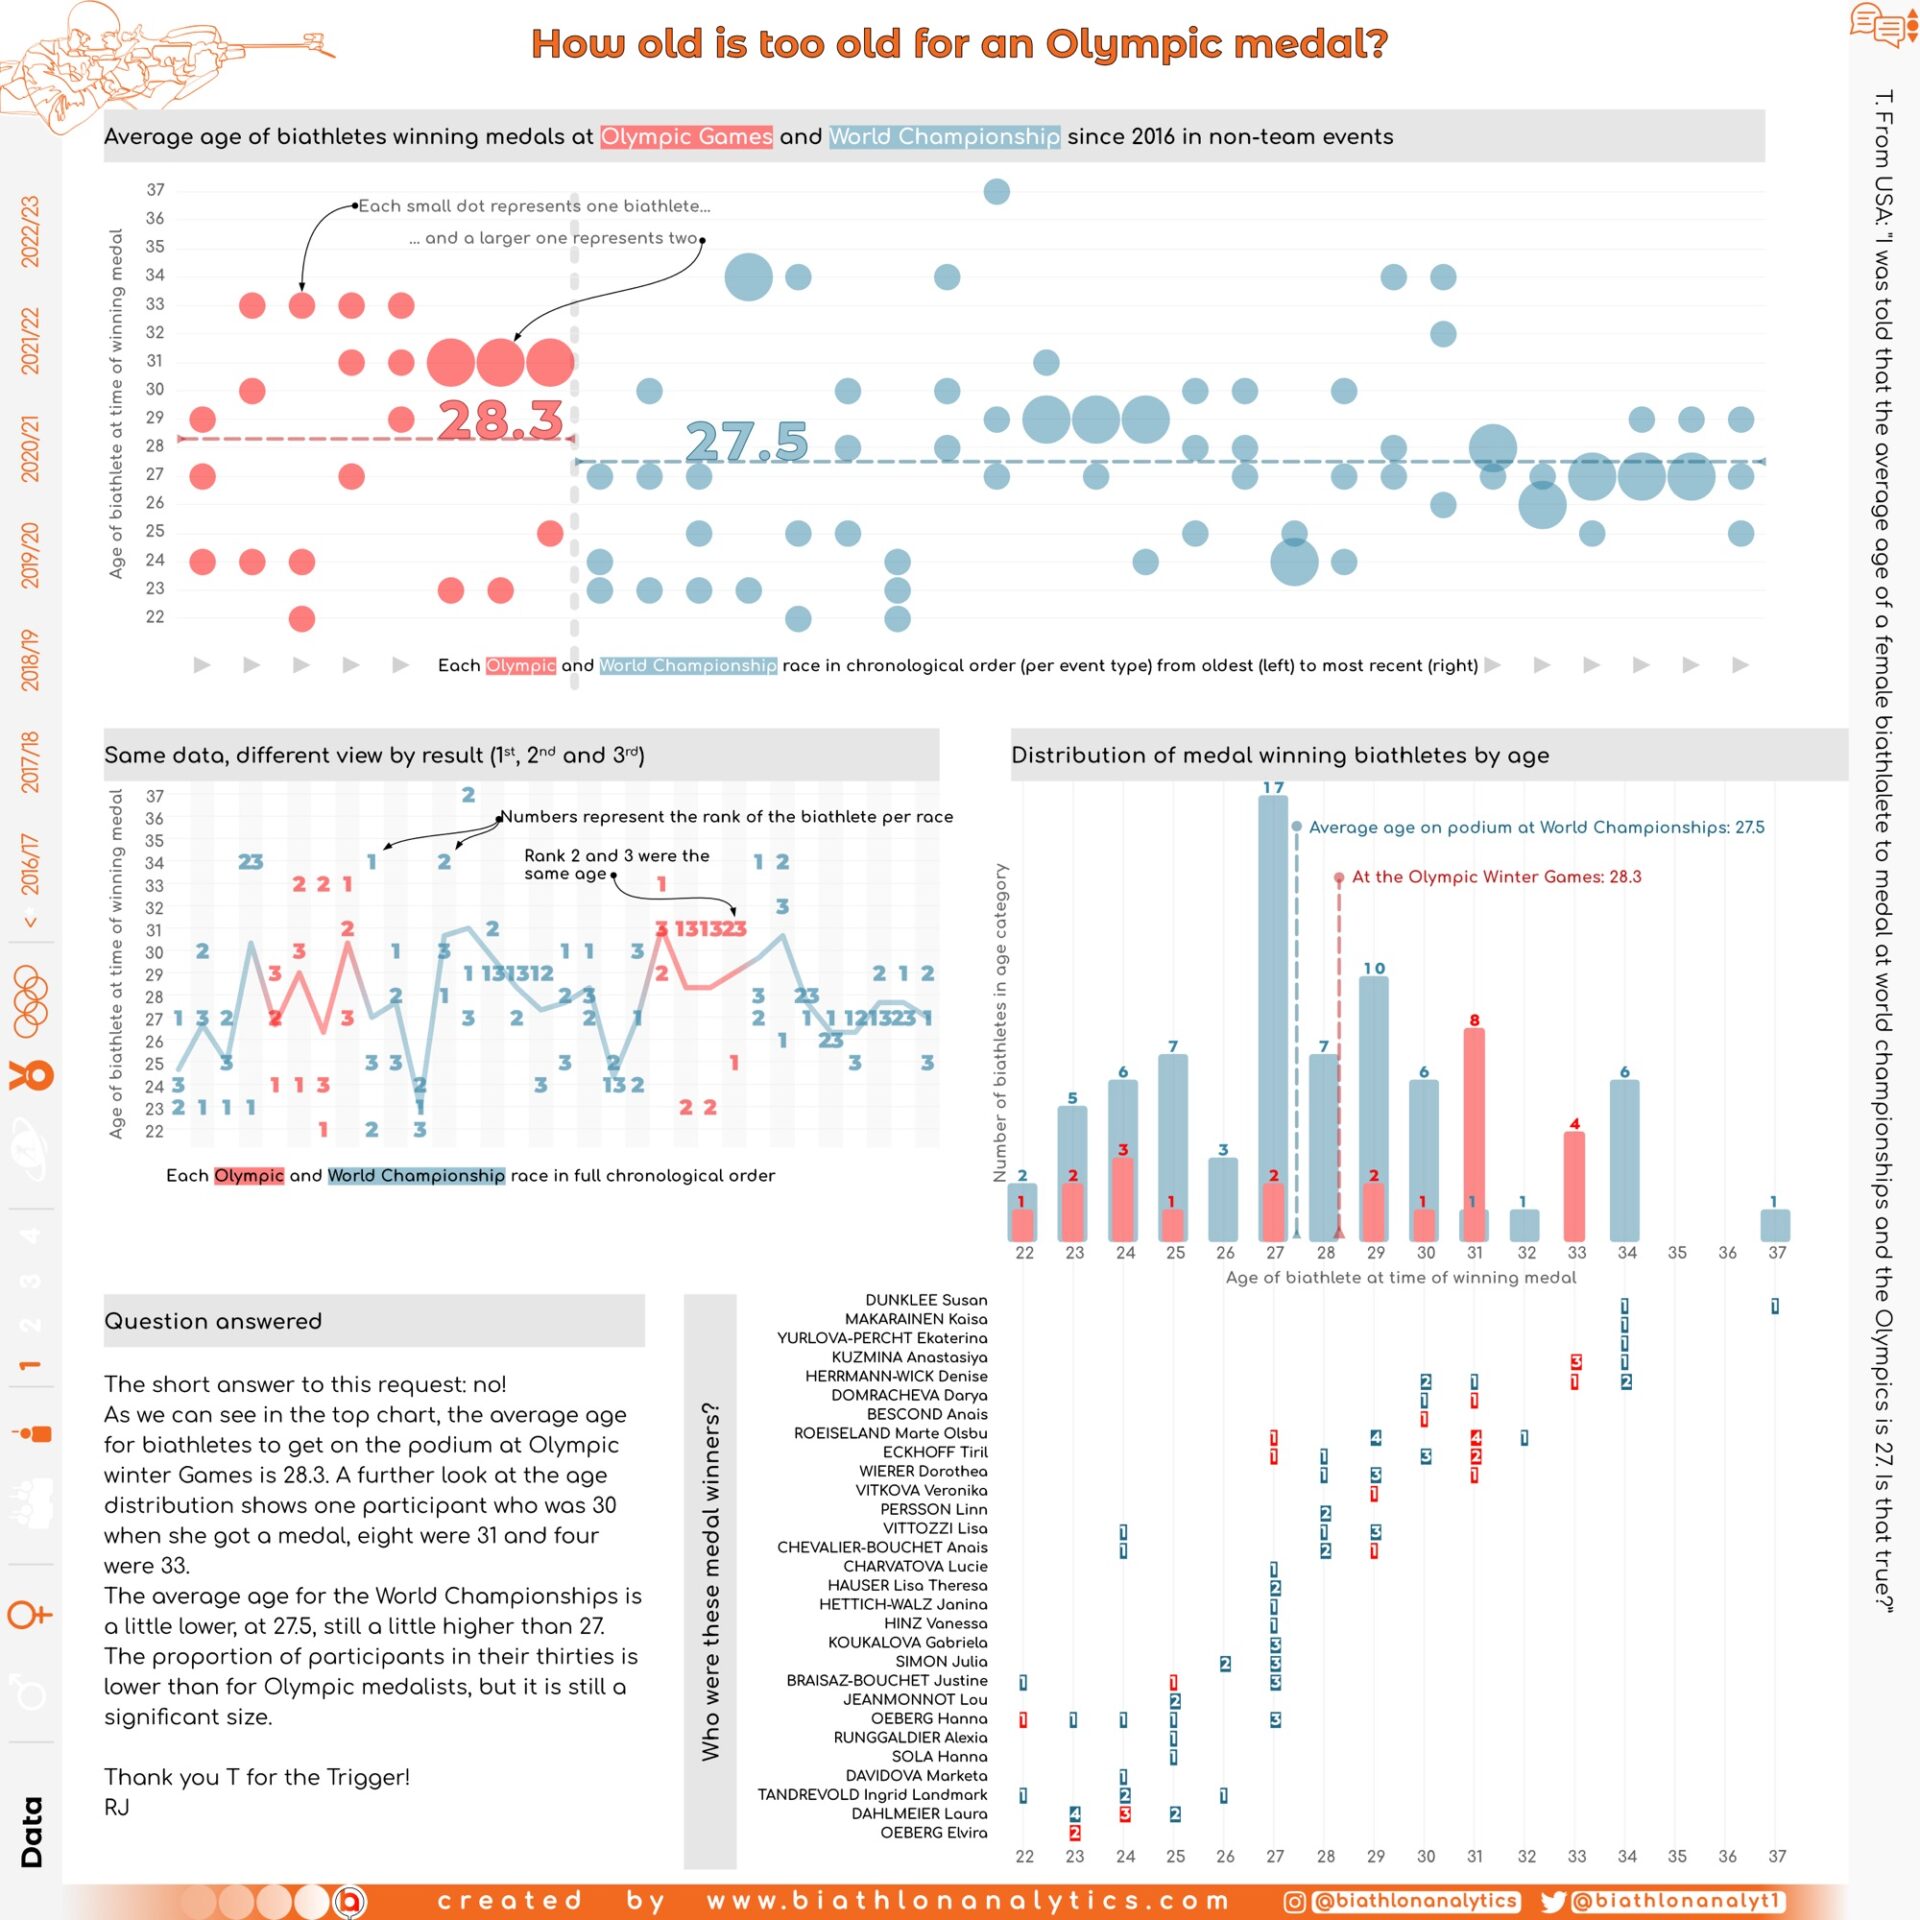
I a recent Trigger request, I was asked about the average age of female biathletes getting on the podium at World Championships and the Olympic winter games since the 2016/17 season. See here the result! Trigger02_27_2024_Tara.pdfDownload
An innovative, modular system developed in collaboration with a Danish manufacturer: Biathlegon
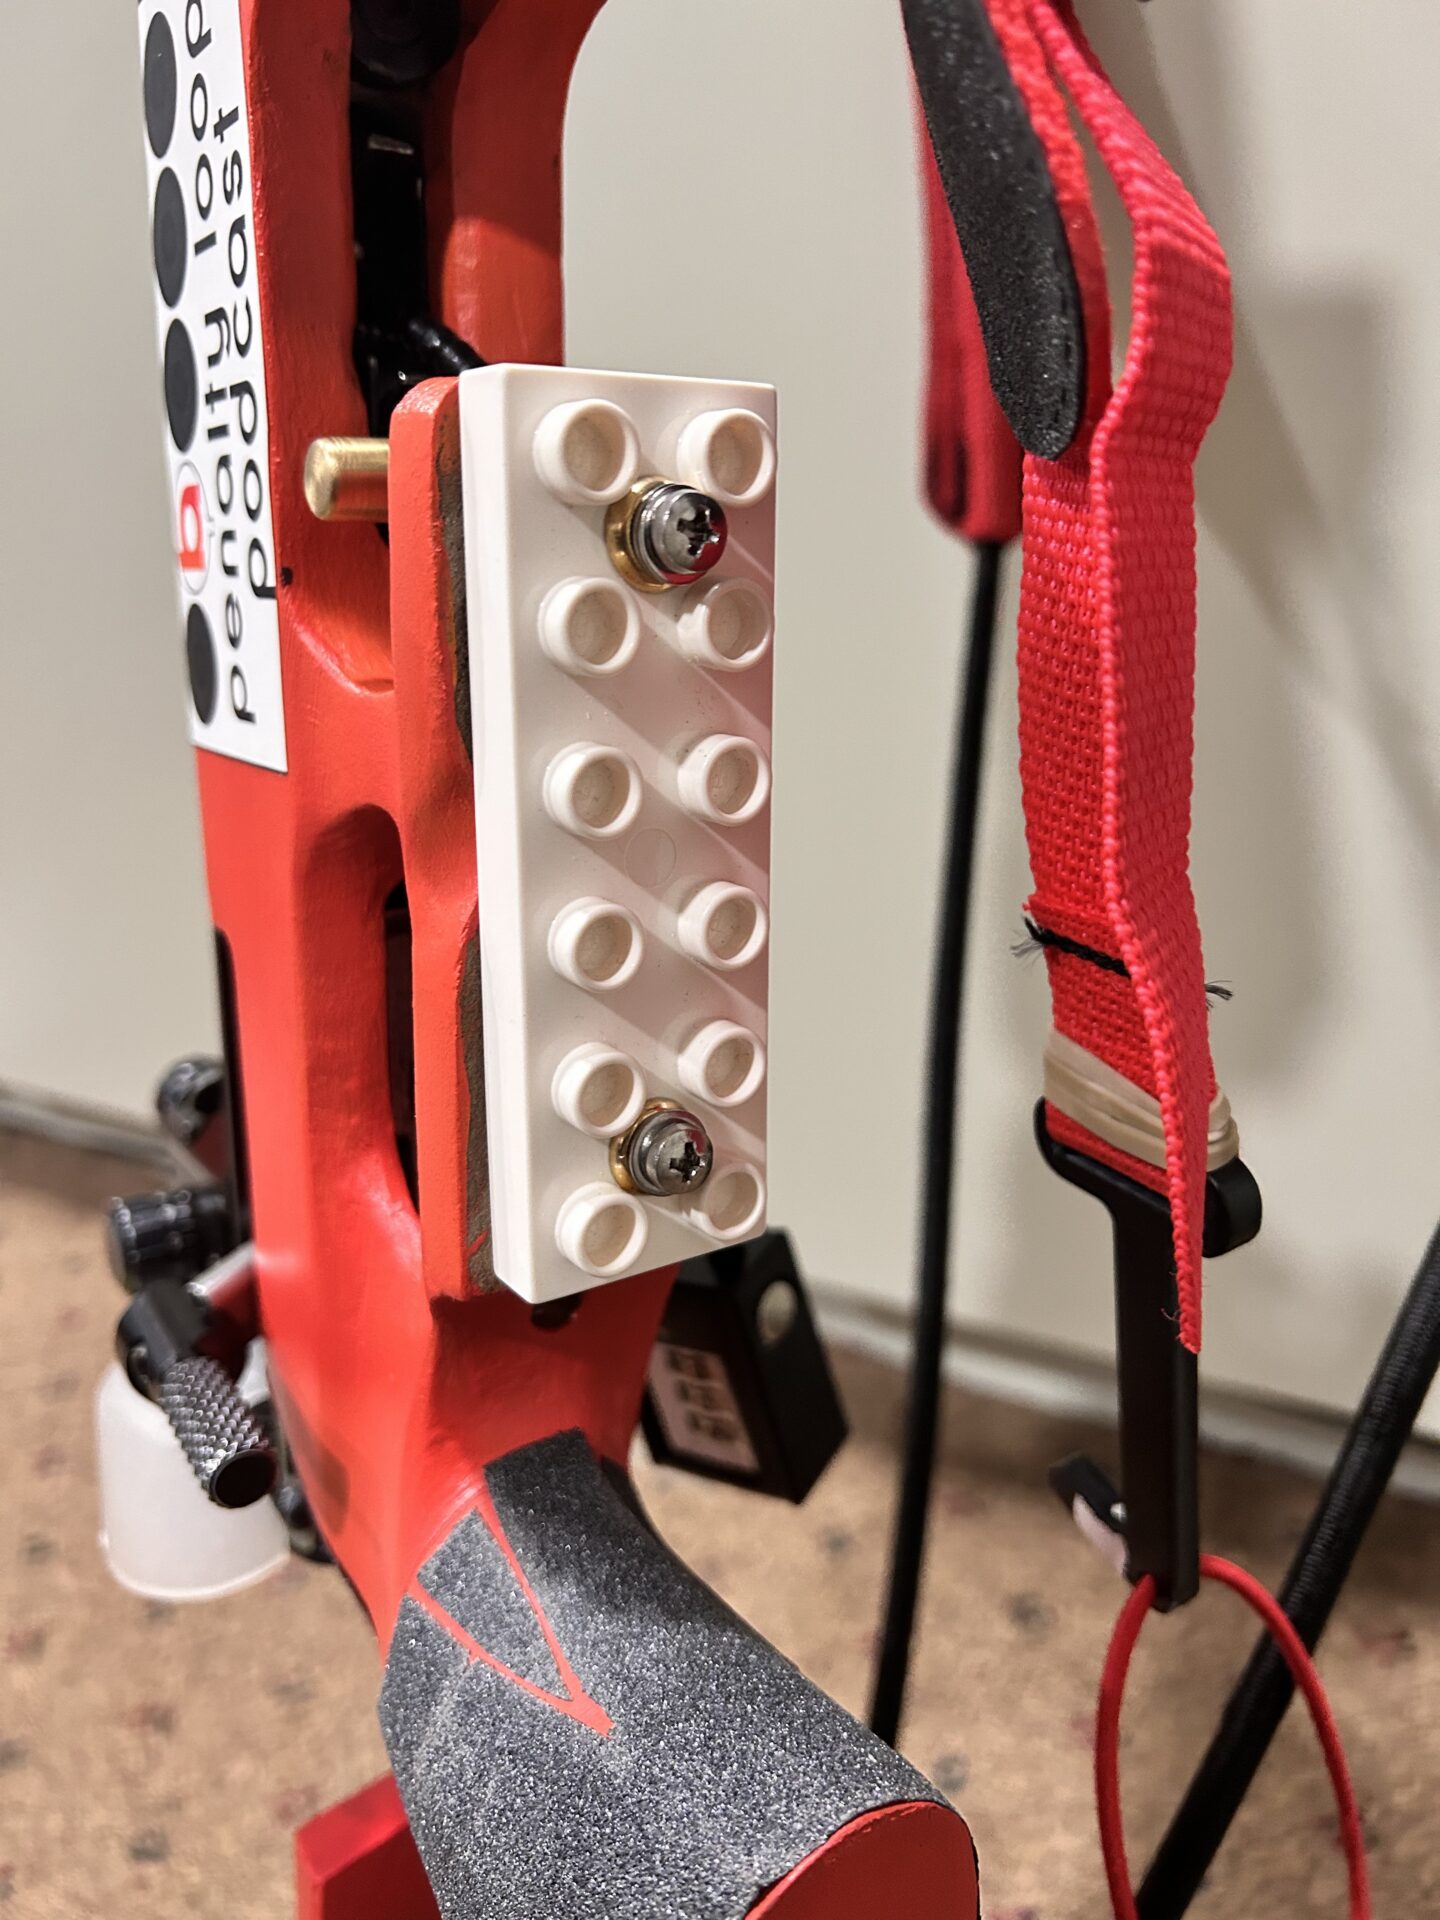
For those not yet so professional biathletes that don’t have the time and money and connections to get a high-end custom setup for your rifle, but still want to experiment with standing-block options and height without the common trial and error method, the following will definitely be interesting for you. You should know, for context, that I have no hips basically, and short underarms. Even with two raiser blocks and a 3d printed standing block from biathlonstocks, when I do my natural alignment while I am in a comfortable standing position, I am aiming welll below the target. I tried…
Has qualifying for the Pursuit become harder?
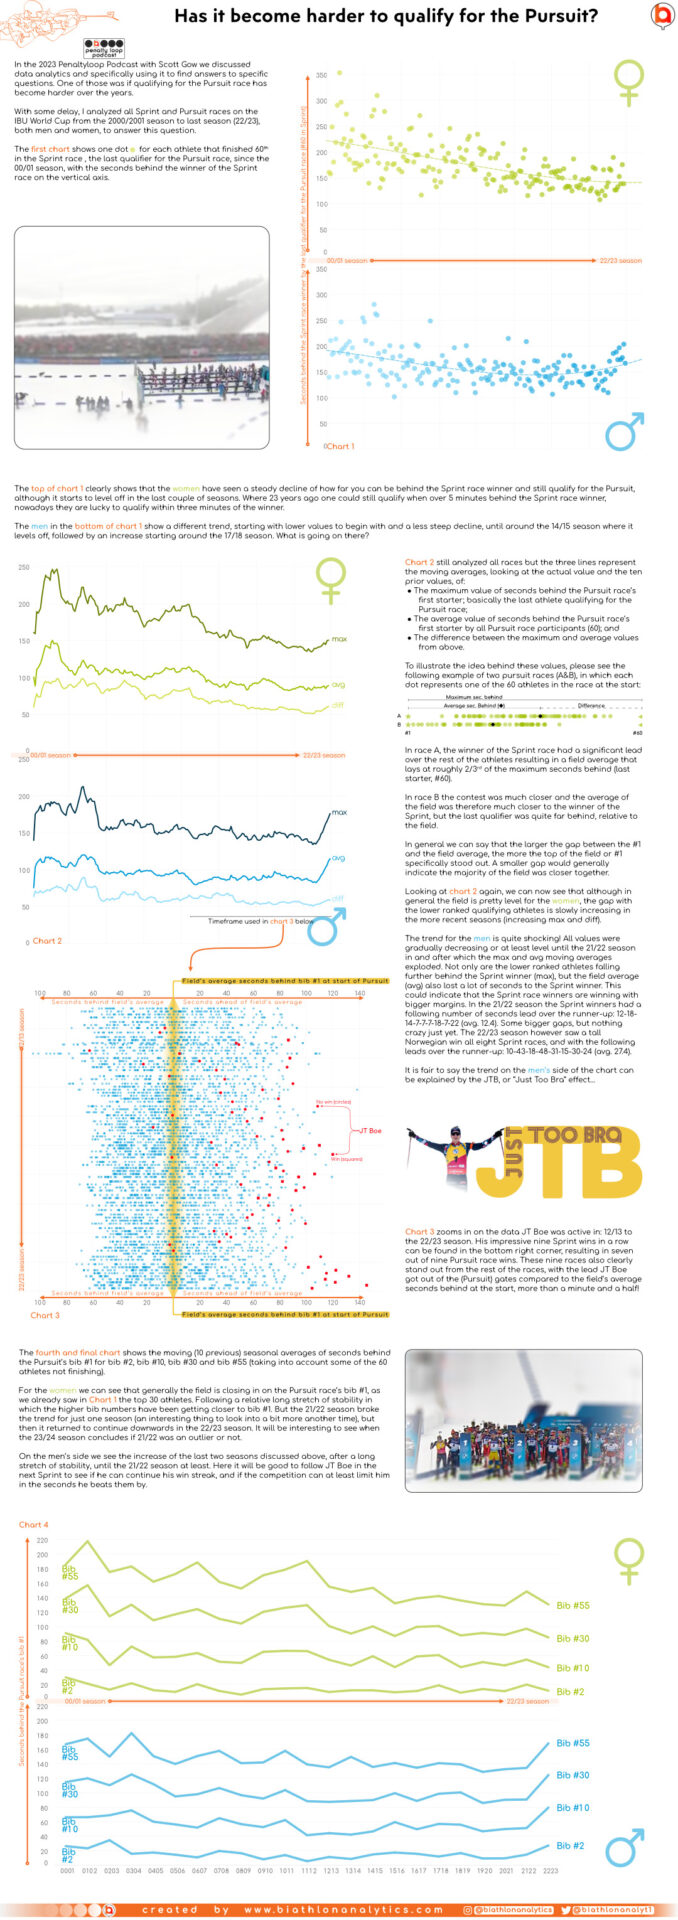
Download the full resolution PDF below Biathlon Analytics – PURSUIT analysis Nov 2023Download
A comprehensive analysis of The Sophomore Jinx in biathlon
As I have mentioned previously on the Penalty Loop Podcast (, S, G), I generally have lower expectations of any kind of athlete in their second season, especially when they had a strong rookie season. Despite some exceptions, when an athlete transitions from their rookie to their second season, things change. In the first season everything is exciting and new, and there isn’t too much expectation. And even if there is, being a rookie is an acceptable excuse if things don’t work out right away. After season one, the realization starts to kick in that this – in the end-…
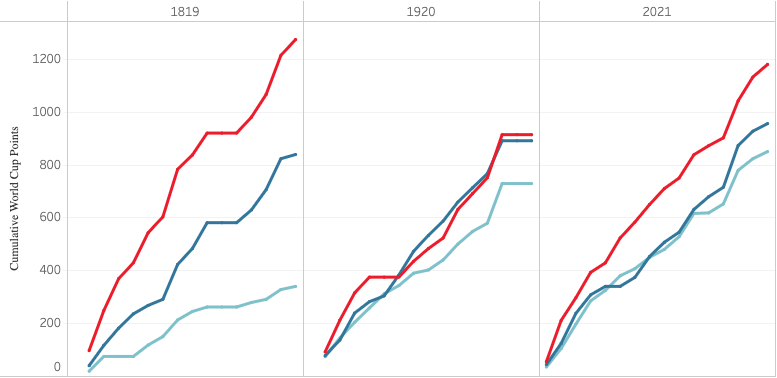
It's Crystal, shaped like a Globe. The ultimate goal.
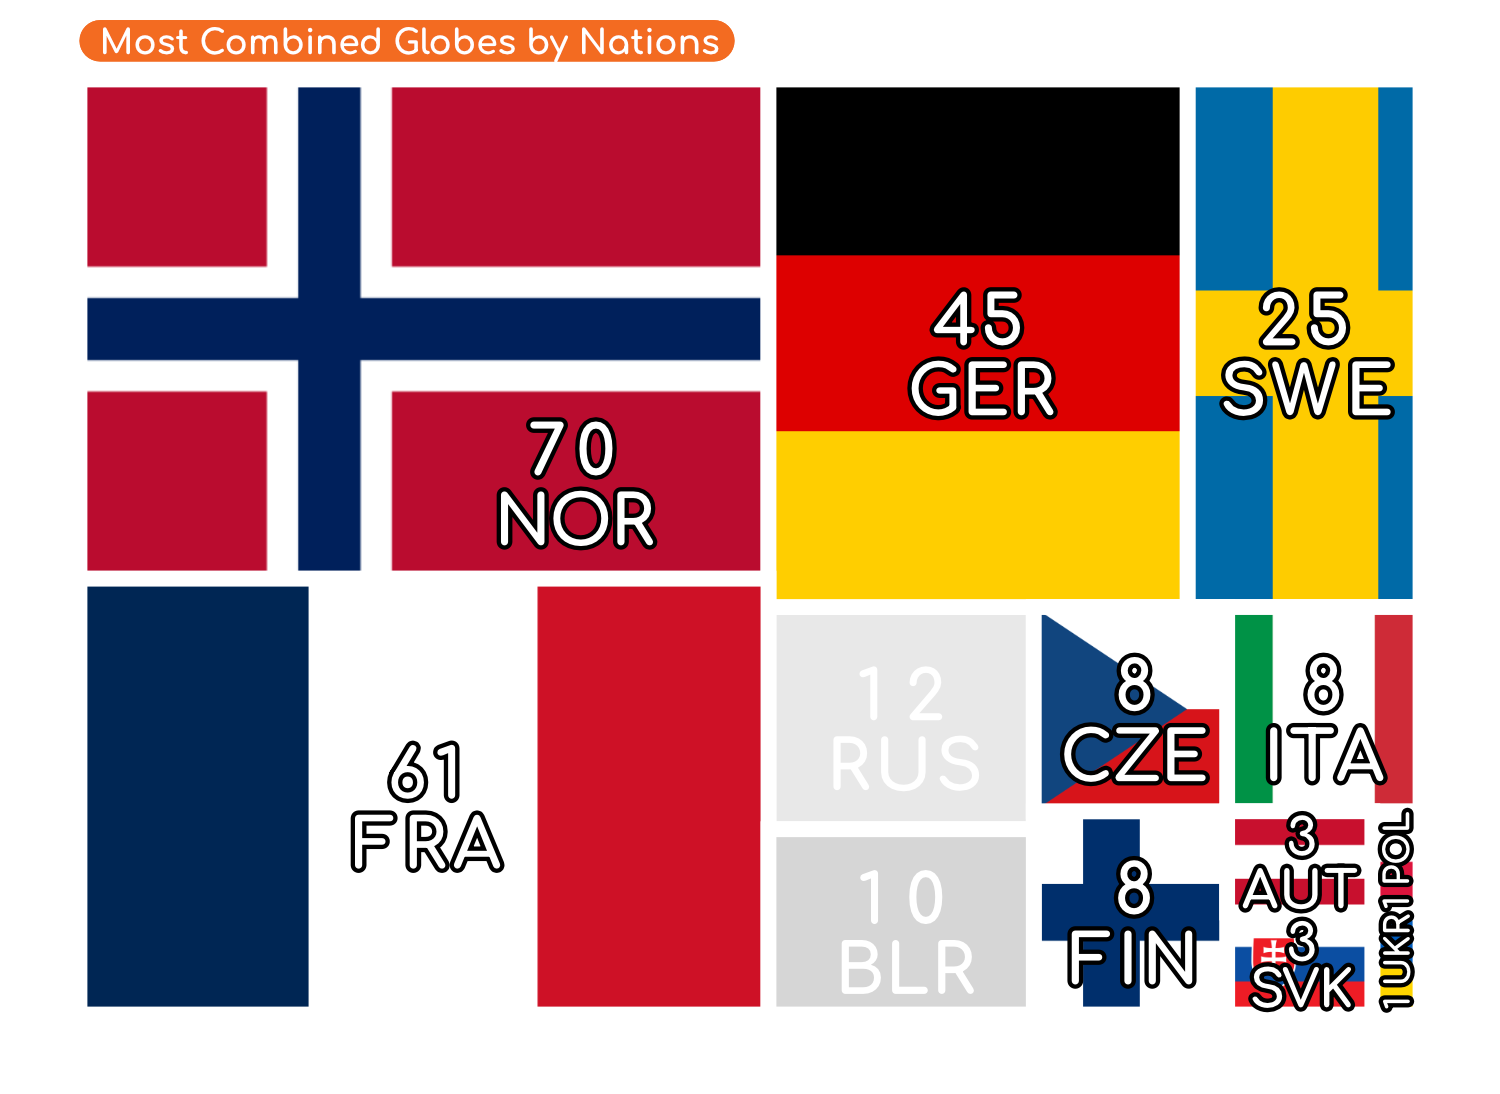
The Crystal Globes are handed out to biathletes who, at the end of the season, have scored the most points in all non-team events combined (Overall), and for each discipline (Sprint, Pursuit, Individual and Mass Start). This post analyses the Globes in the last 25 seasons based on a Trigger request by Kristen K. Globe Winners Over the last 25 seasons, from 1998/99 to 2022/23, we had 50 Overall Globe winners, split between women and men. The visual below shows that nine of those not only won the Overall Globe, but also the four Discipline Globes in that season. Tora…
Where Biathlon Nations rank, based on individual race results in the last six seasons
I have to admit this post-season-break had me away from biathlon a little longer than anticipated ( I blame it all on Jordan’s family having a new member in their family!). The good part is that I’m again fully loaded for some new articles and triggers! I started a new project during the season and put it away until the season was over, and it started with the Trigger description: “We know that the Norwegians are a dominant force on the IBU World Cup, but when we look at the number of participants for each rank in the last six…
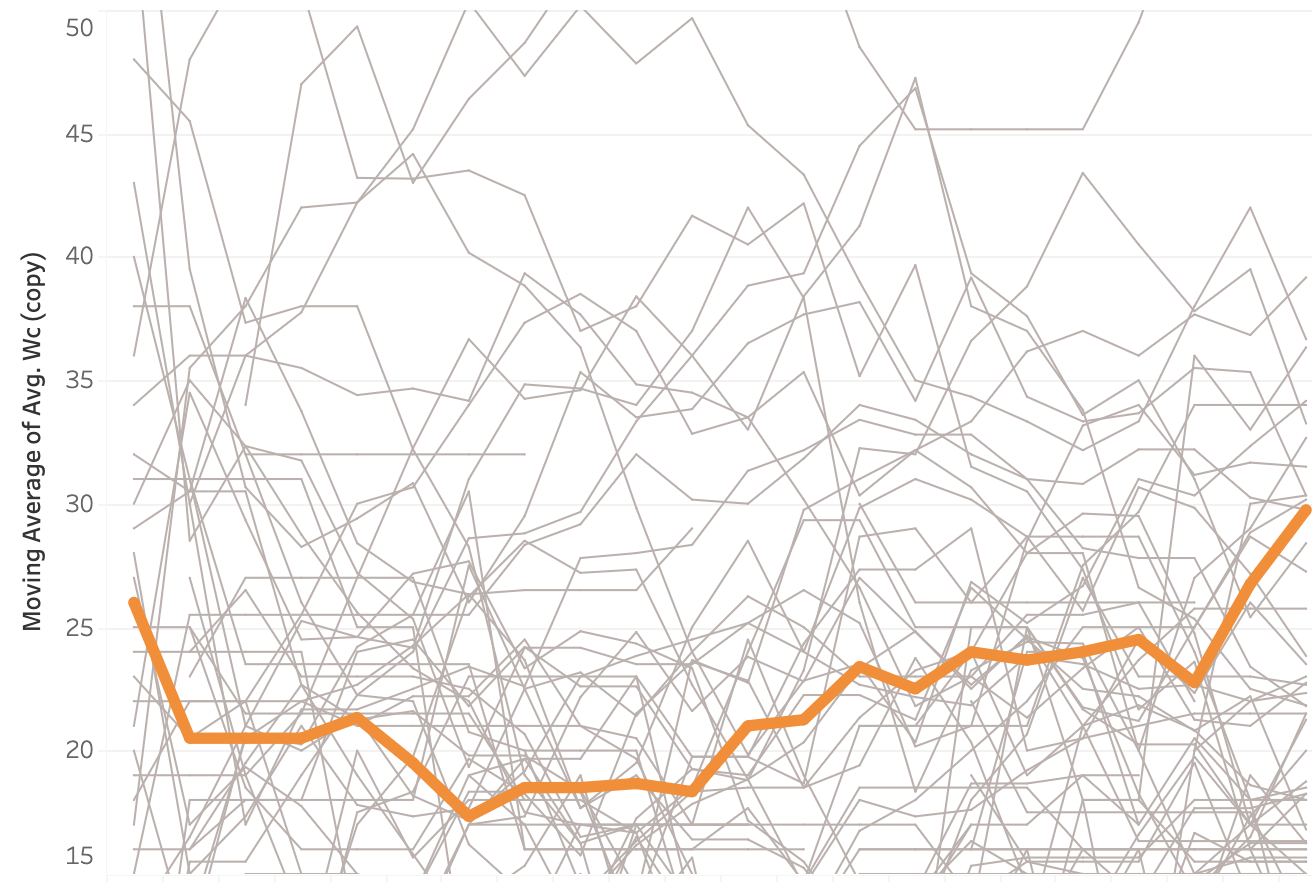
Trigger request – maintaining performance over a season
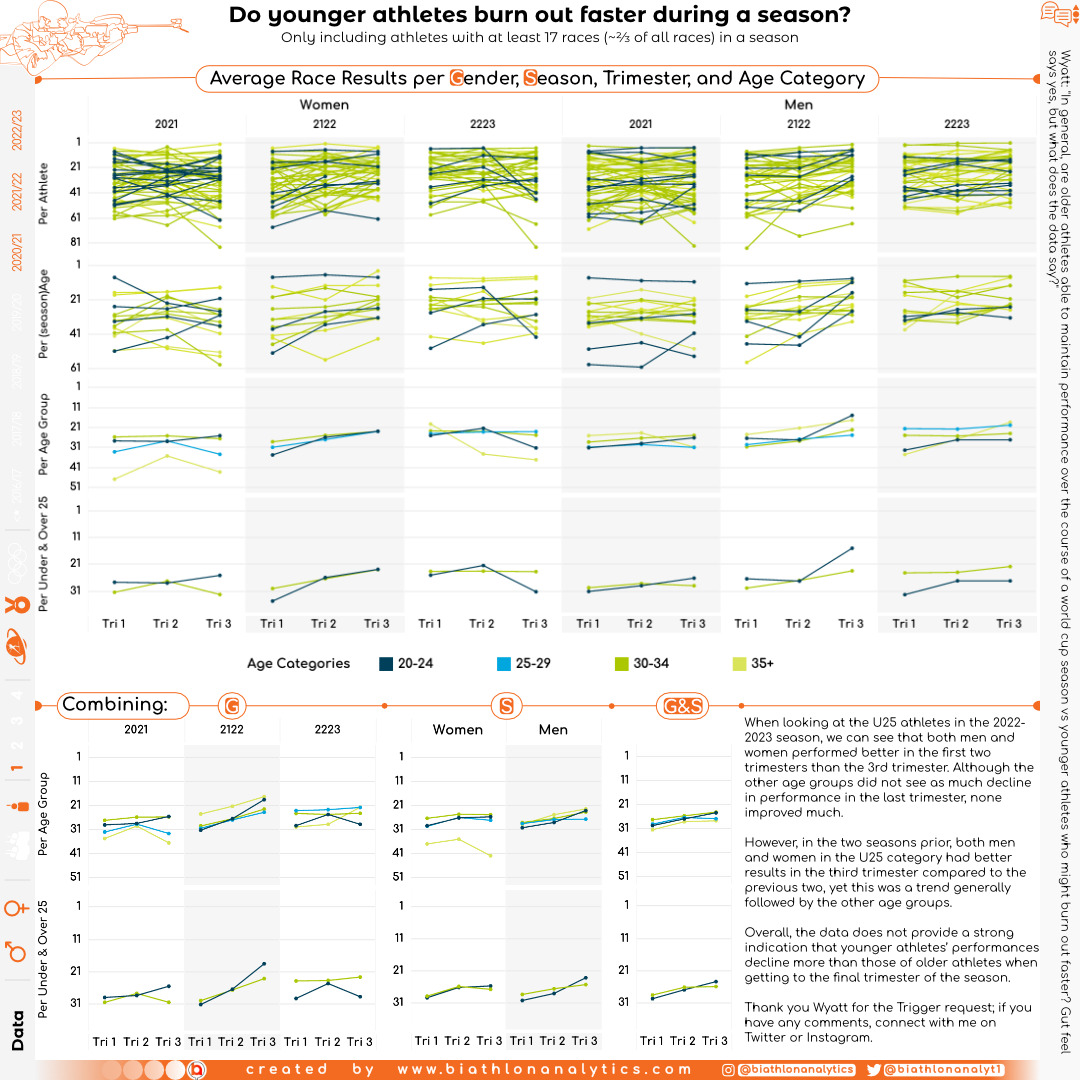
A couple of weeks ago, I received a Trigger request from Wyatt: “In general, are older athletes able to maintain performance over the course of a world cup season vs younger athletes who might burn out faster? Gut feel says yes, but what does the data say?” He checked off the boxes for all seasons, but to keep the data manageable I looked at the last three seasons only. And since we’re talking about form during the season, I only included athletes that participated in 17 races, roughly two thirds of all races, in a season. He imagined some kind…
We have a new master of consistency! The longest* streaks in Biathlon
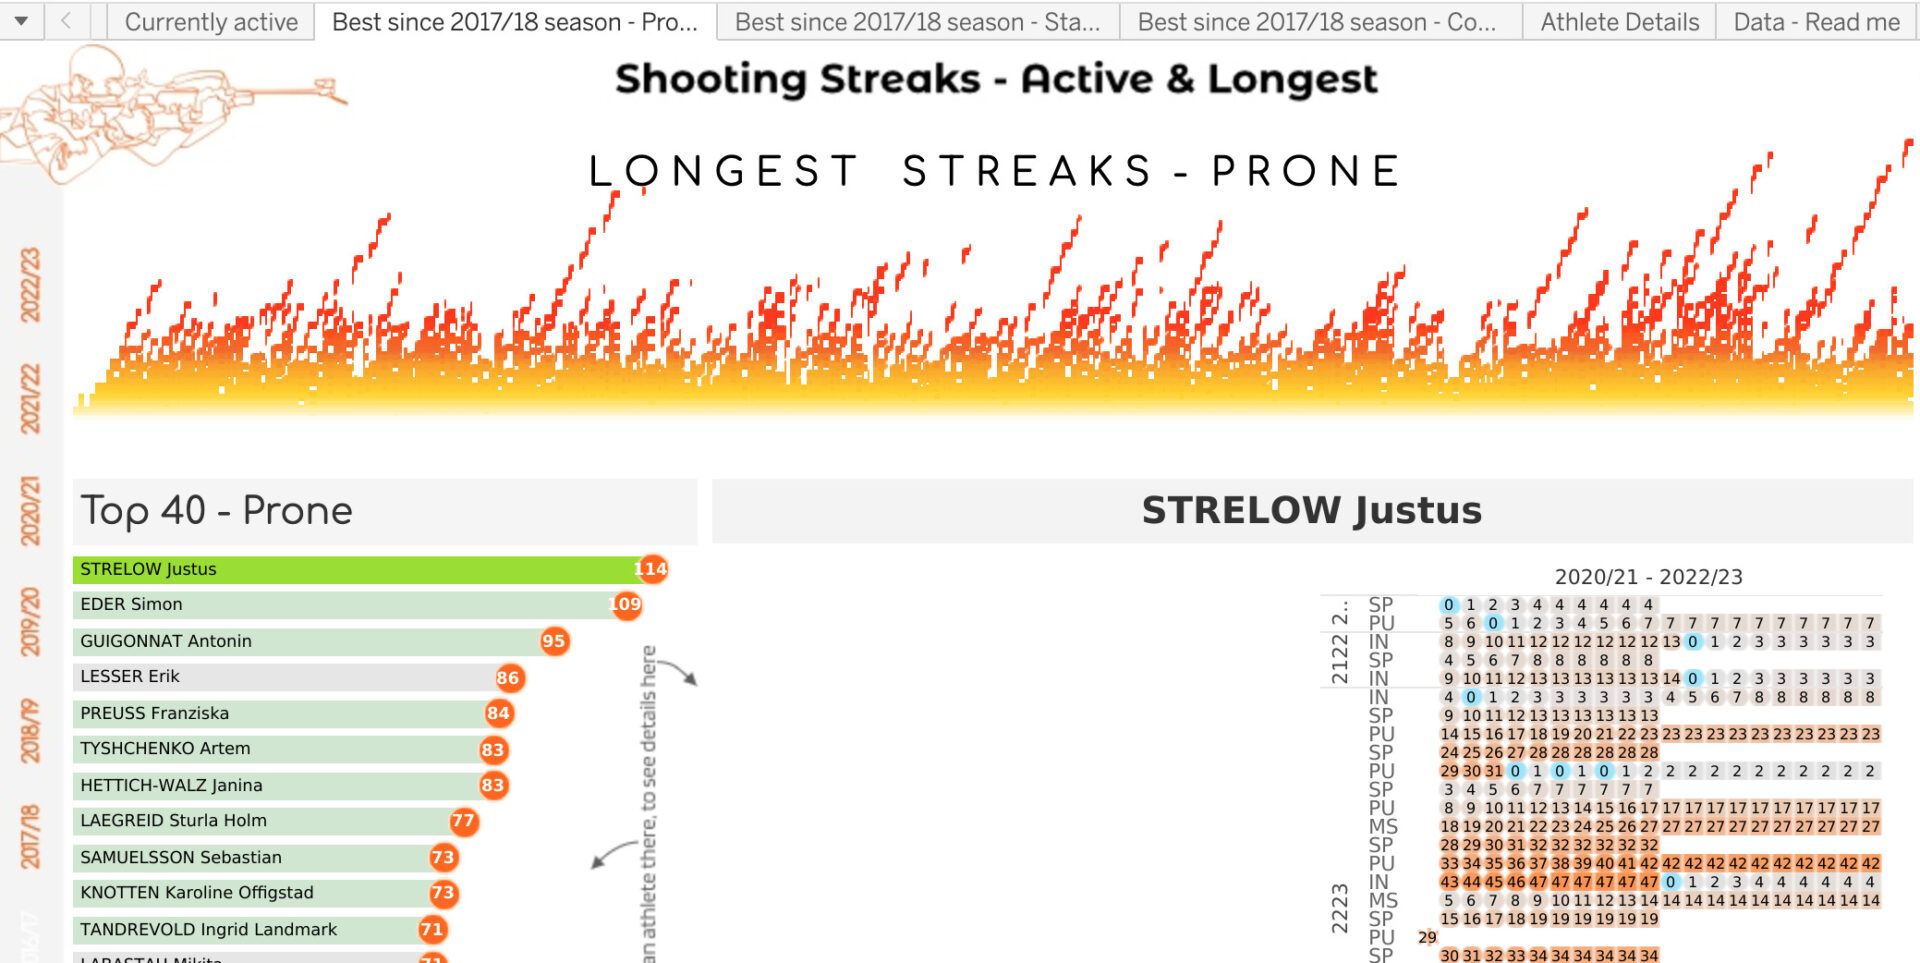
About a third into the season, I posted a dashboard with the current shooting streaks for Prone, Standing and Combined shooters at the World Cup level. Then, mid-January, Simon Eder got to an incredible 104: Simon Eder hits 104 Prone shots in a row, and counting And later the dashboard even showed him at 114 before missing the first Prone shot of the second shooting in the pursuit race in Antholz: Fast forward to the end of the season. I update the dashboard with the latest data from Oslo to make a final version, and something doesn’t look right. More…
Historic biathlon results create expectations. But what about points?
The W.E.I.S.E. has a new and more detailed measure for performance based on historic results: EXpected Points
What do you expect? Practical applications of the W.E.I.S.E.
Practical applications to further explain the W.E.I.S.E. and demonstrate its potential value in performance analysis in biathlon
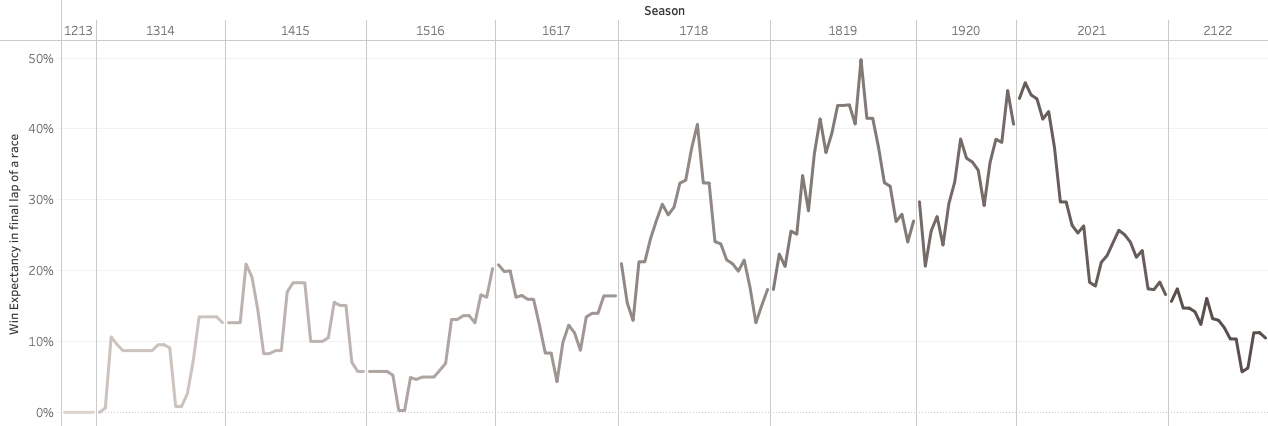
Introducing W. E. I. S. E: the Win Expectancy Index based on Statistical Exploration, version 1
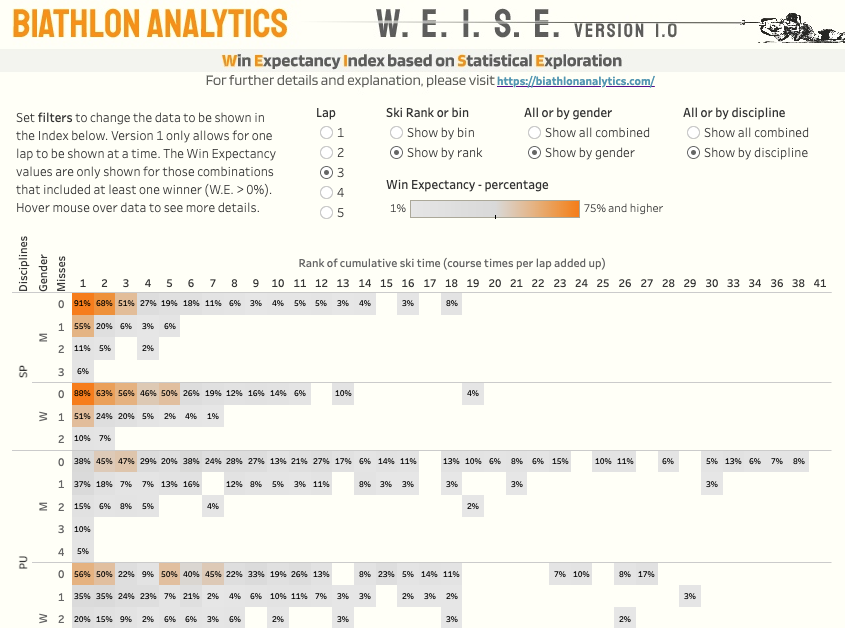
An introduction and explanation of the Win Expectancy Index based on Statistical Exploration, or W.E.I.S.E. for short, for biathlon.
Peak age for biathletes at the World Cup level
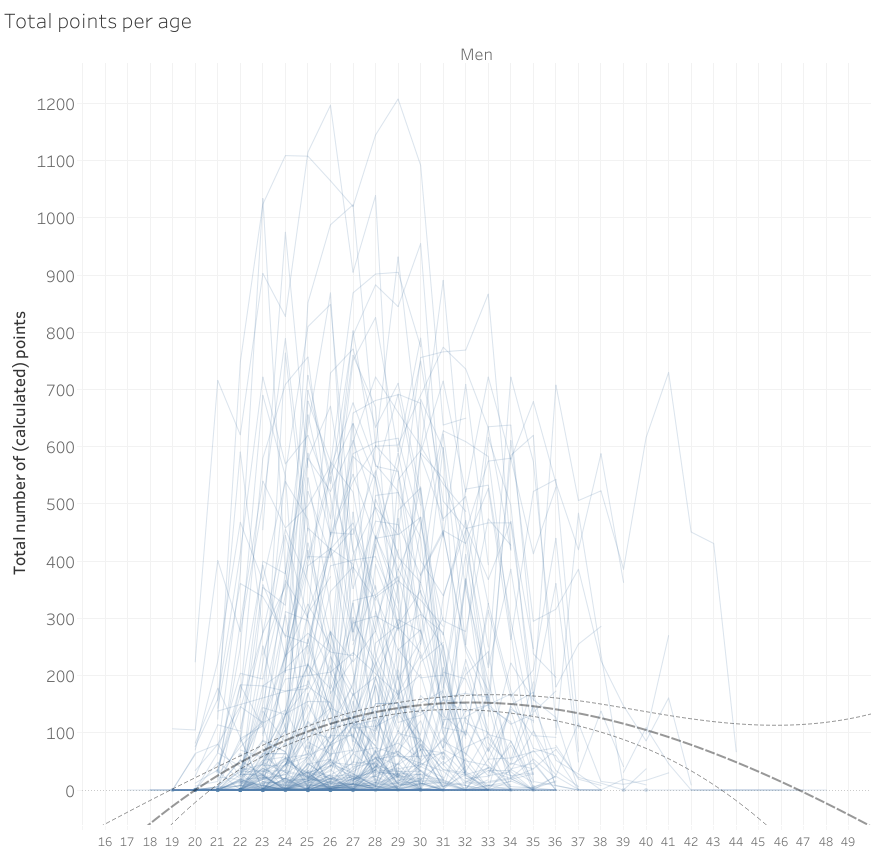
Looking at calculated points, athletes and race participants to determine the peak age for biathlon athletes.
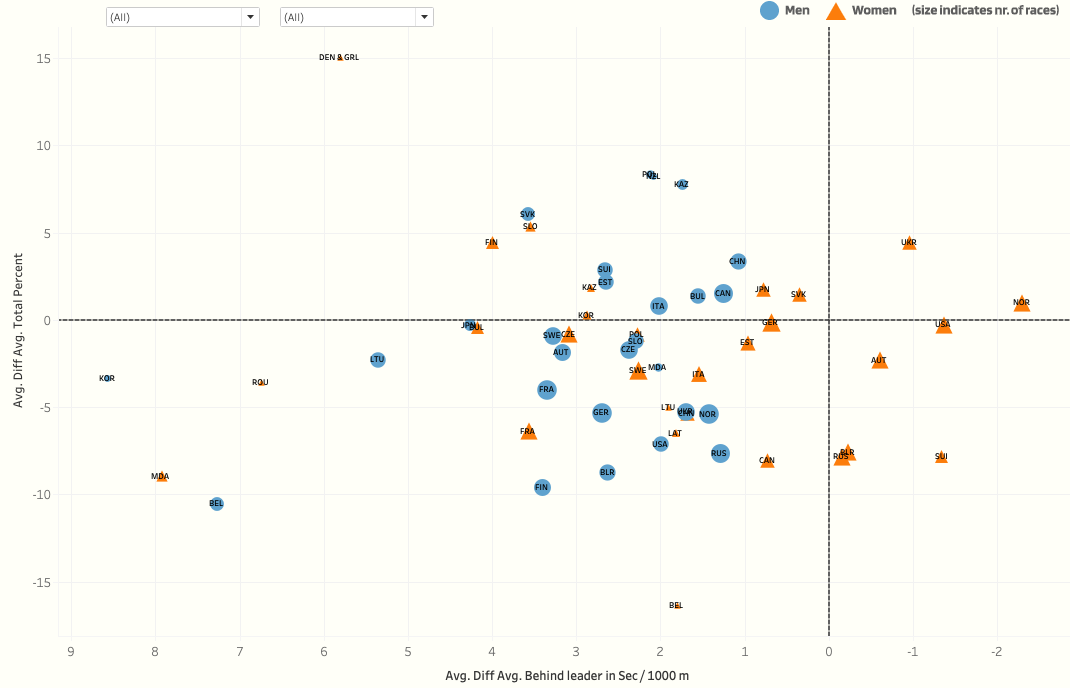
Analyzing the strength and depth of Biathlon Nations
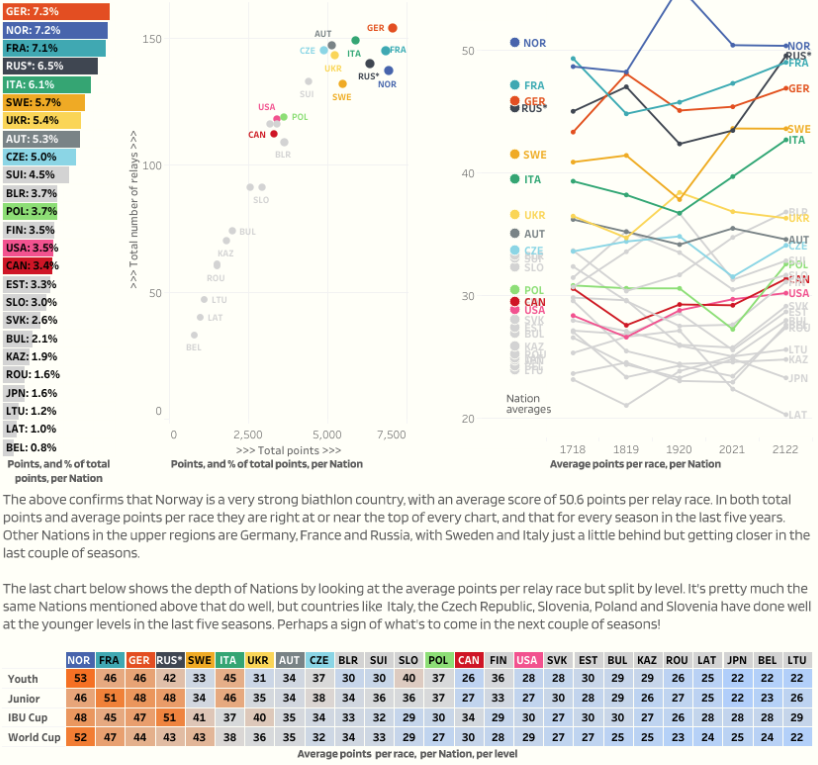
Although it is fair to say that the top Nations in biathlon are pretty clear, I wanted to look a little deeper and see which Nations were strong in the last five seasons, which ones have been getting stronger, and what ‘smaller’ Nations have been looking upward.
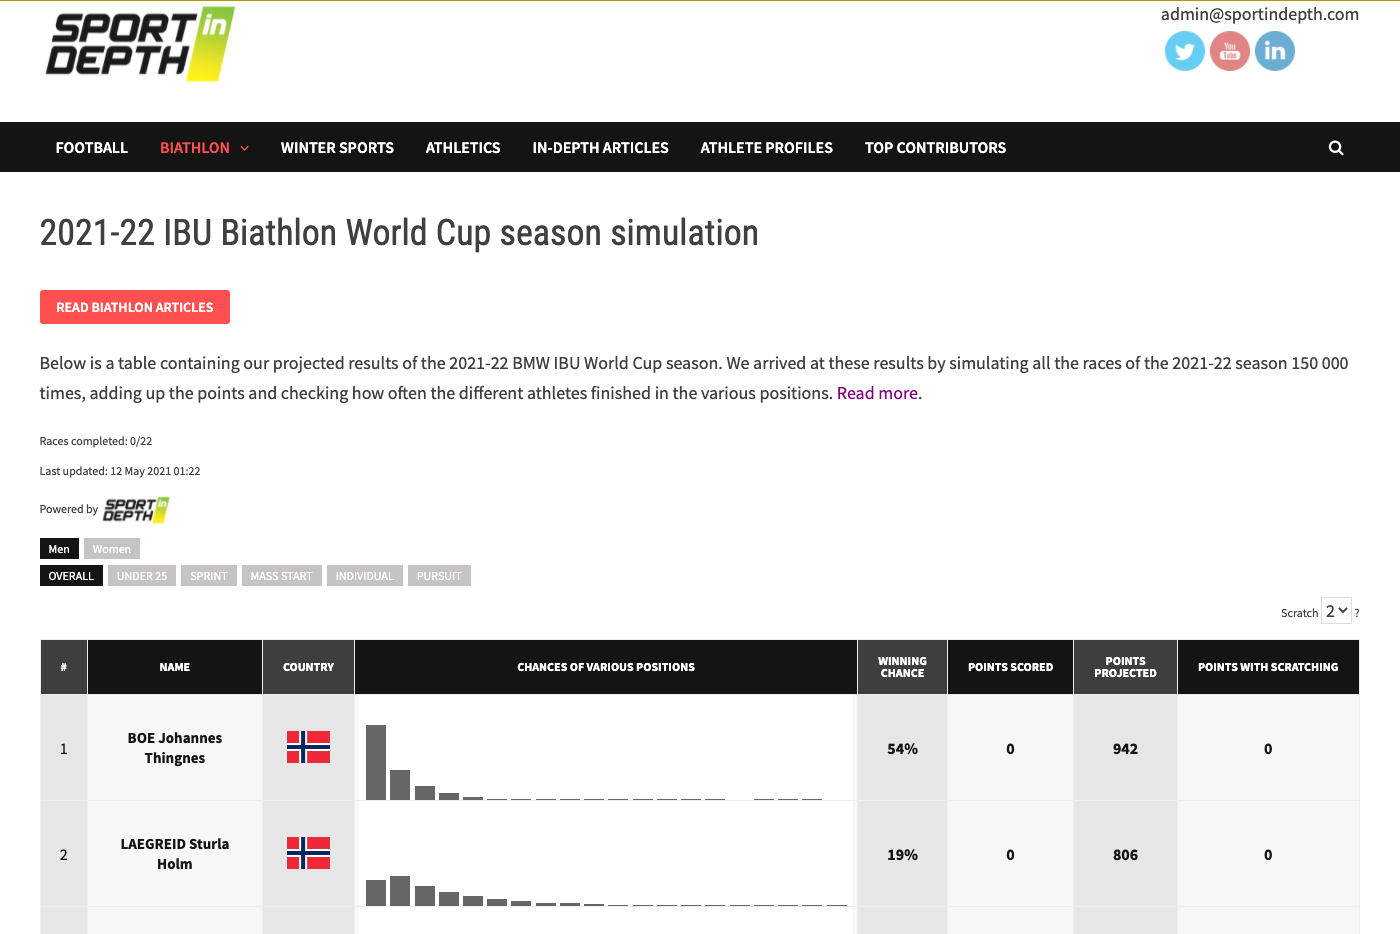
End of season stats for the IBU World Cup 2021-2022
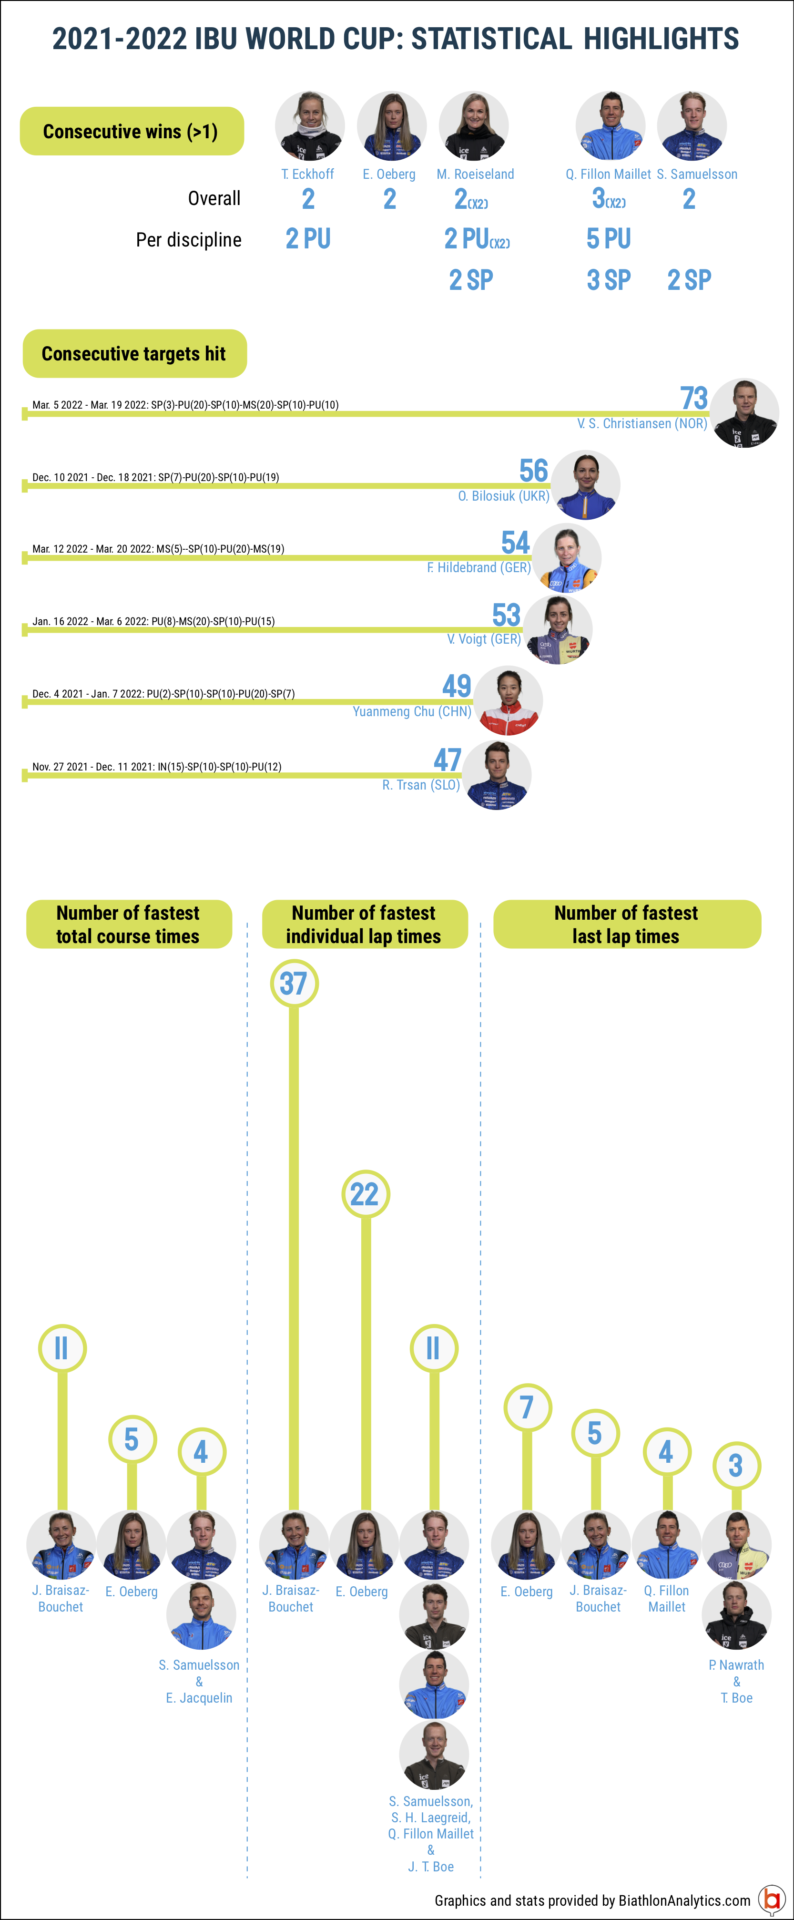
Excluding Olympic Games Same but with Olympic Games included Download the PDF files BiathlonEndOfSeason2022excludingOlympicGamesDownload BiathlonEndOfSeason2022includingOlympicGamesDownload
Getting the most out of Tableau dashboards
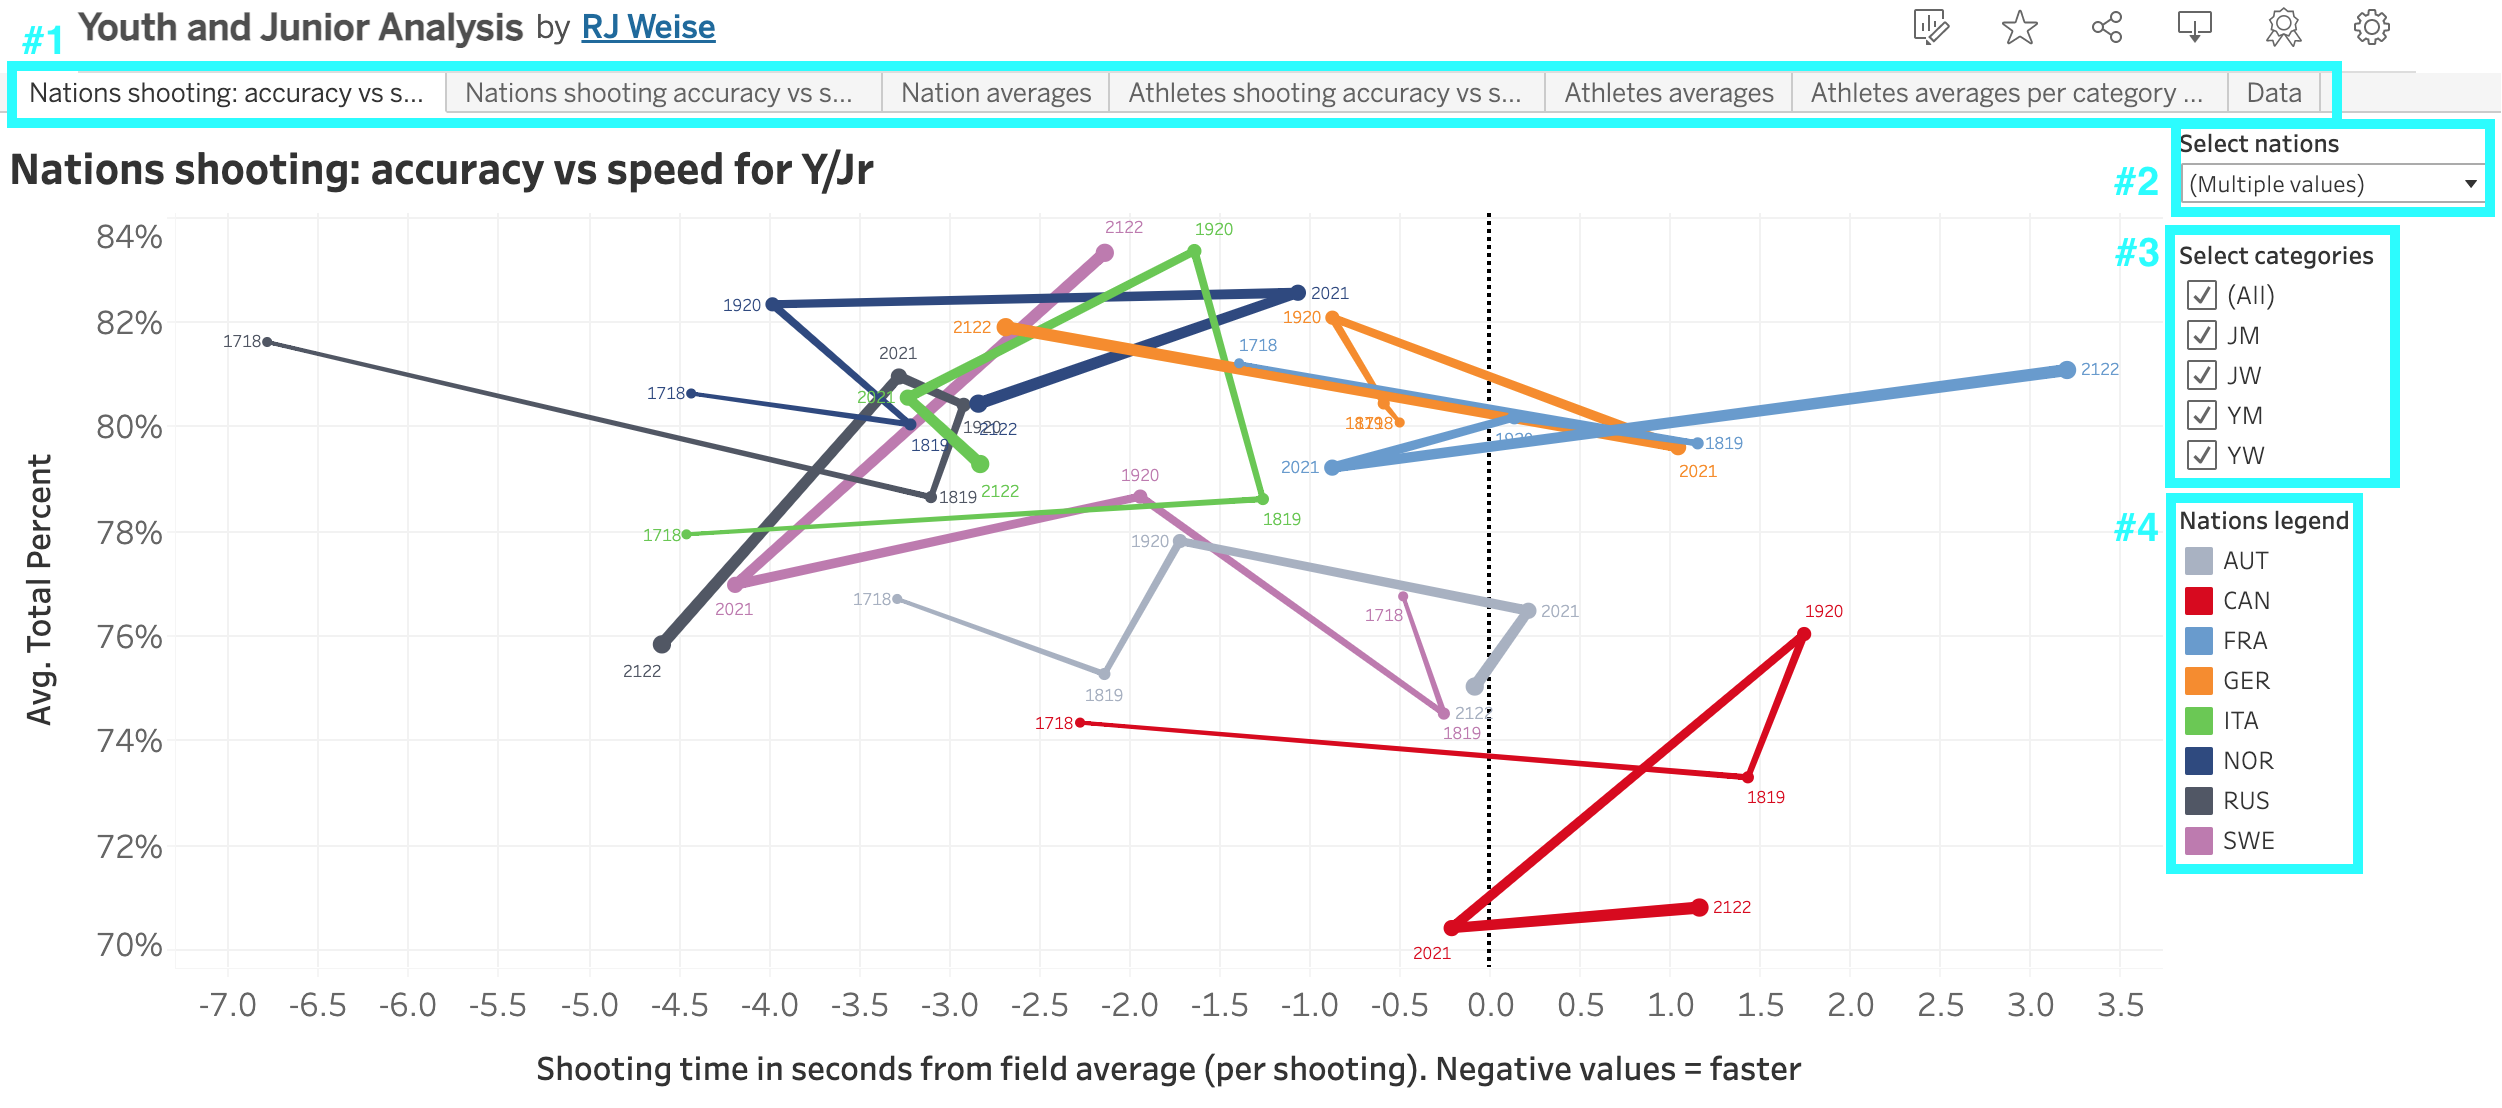
Long overdue, this short post helps users of the Youth and Junior Analysis and IBU Cup Analysis dashboards to use all features it provides. Since they work in pretty much the same way, I’m going to use the Youth and Junior Analysis one to demonstrate a few tips and tricks. On the main page of the dashboard we have a couple of features: #1 Tabs. You would be surprised how the first tab is much more viewed than any other tab, likely due that many users just don’t realize there are multiple tabs. Note that sometimes when the dashboard has…
Who were the best performing biathletes at the Beijing Olympics?
Looking at Olympic performance improvements in biathlon
Rallenta Lisa; the athlete with 2 faces
Slow down Lisa! Looking at additional ways beyond the mental issue to get her back on track in her first shooting.
Cool ways to measure and display ski speed in biathlon
This article makes an attempt to review and recommend different ways to measure and display ski speed in biathlon for die-hard and casual fans
Has the field gotten narrower?
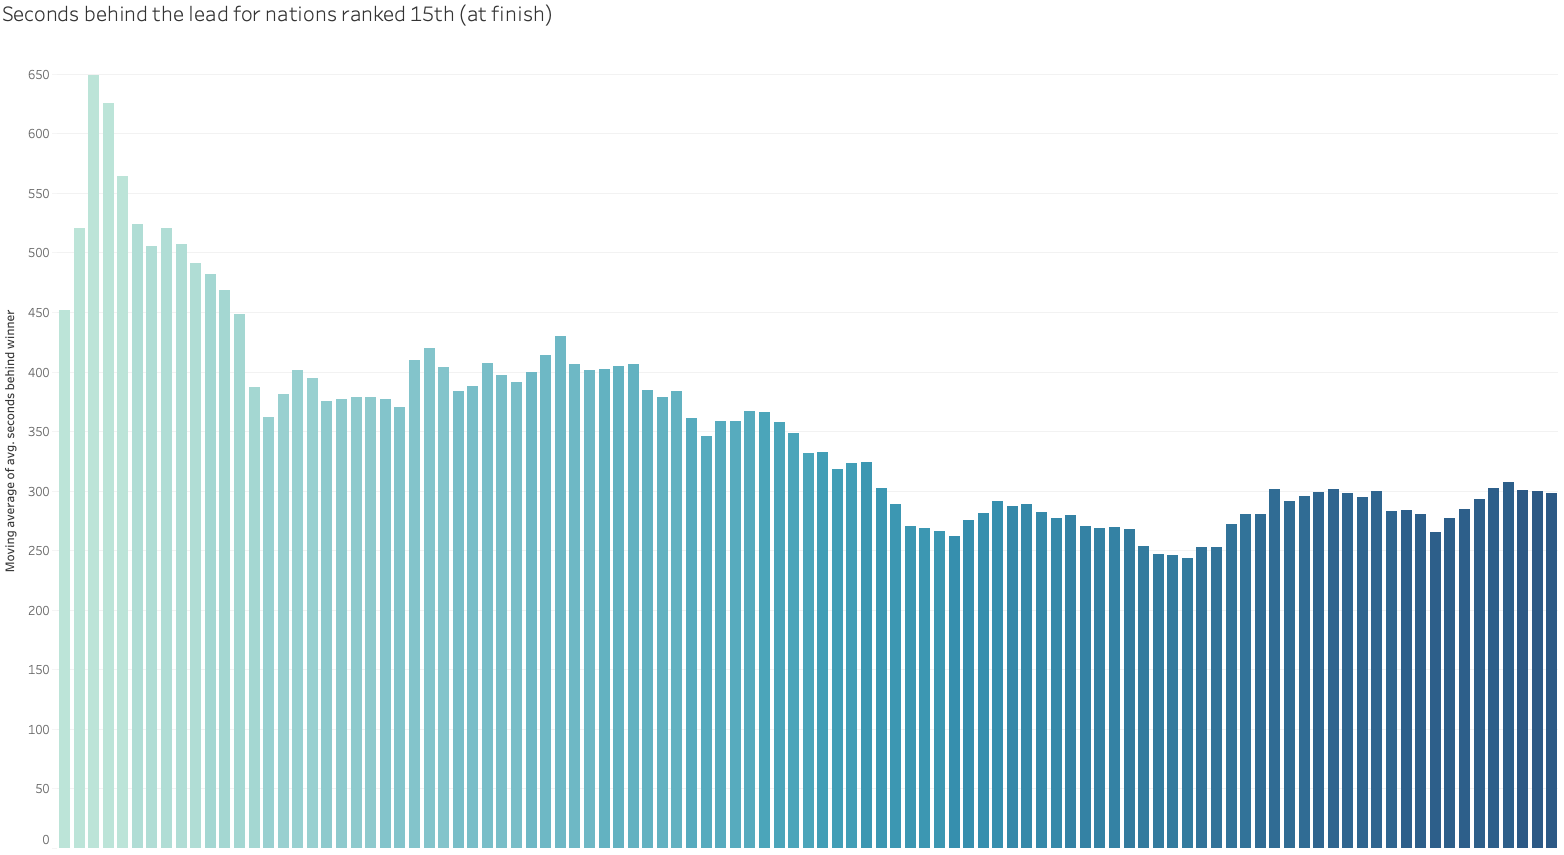
A quick look at the gap between biathlon nations
And we continue our Shot data analysis
Some additional analysis of shot data in biathlon
A continued exploration of shot data
A continued exploration of shot data, based on a twitter conversation with Bjorn Ferry
Is One Shot Like Any Other In Relays In Biathlon?
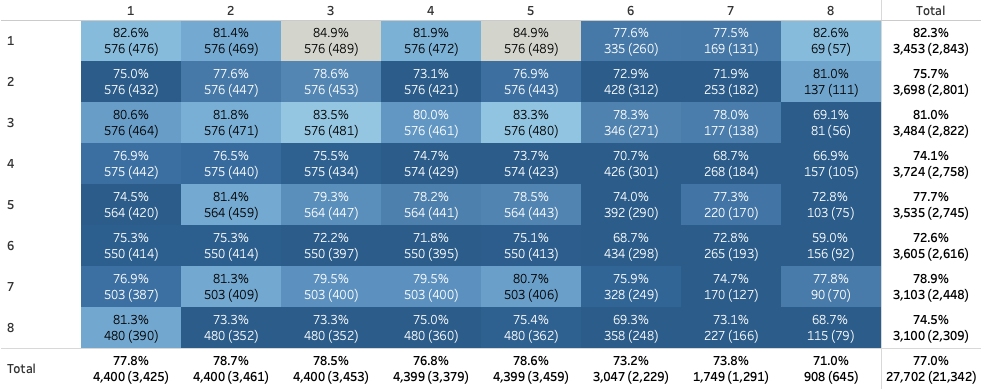
This article looks at the hit rates per shot in biathlon relays, shooting pressure and relay tactics.
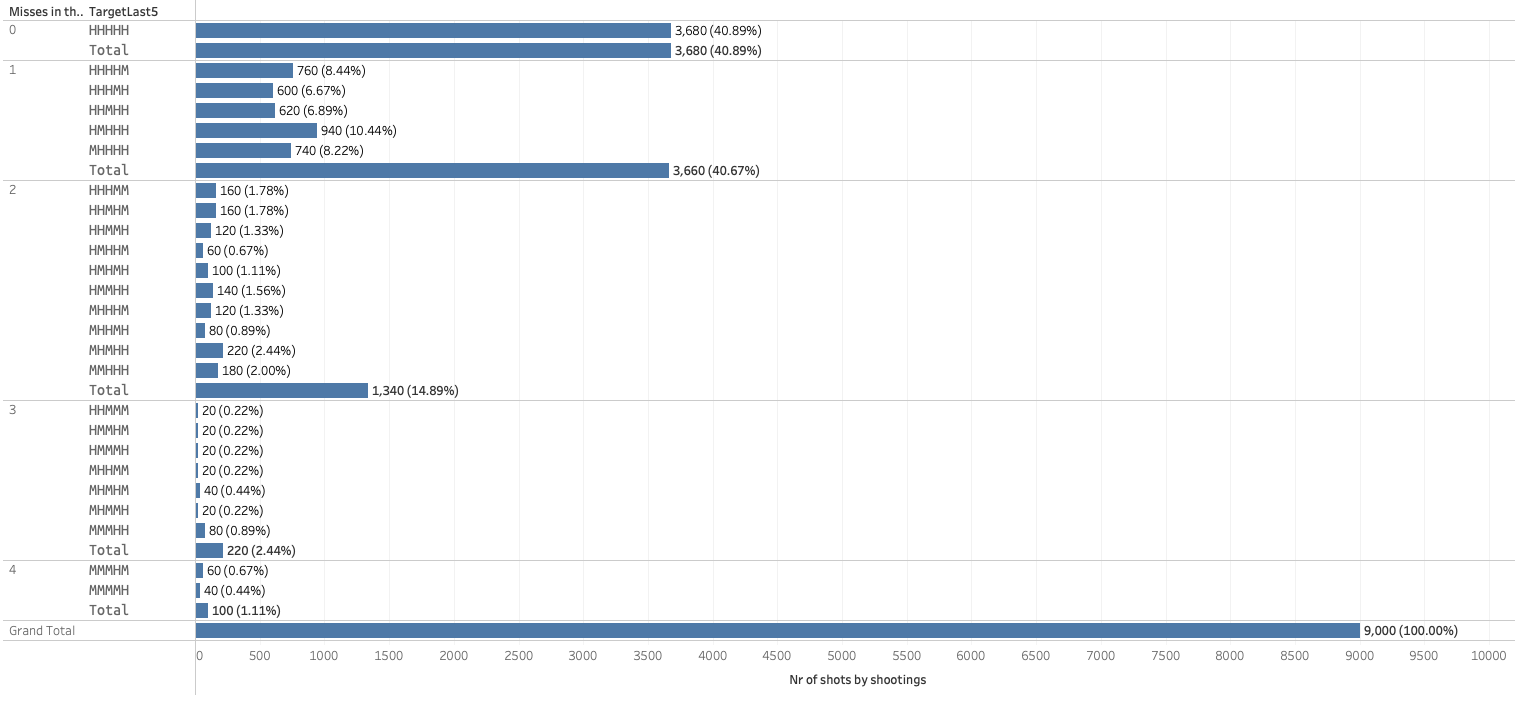
Is one shot like any other in biathlon?
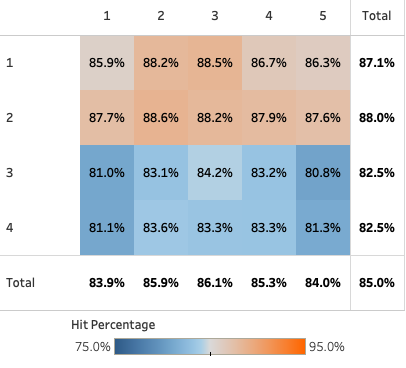
Can shooting percentages be directly related to shooting pressure? And are all shots equal? Let’s find out.
Is there home advantage in biathlon?
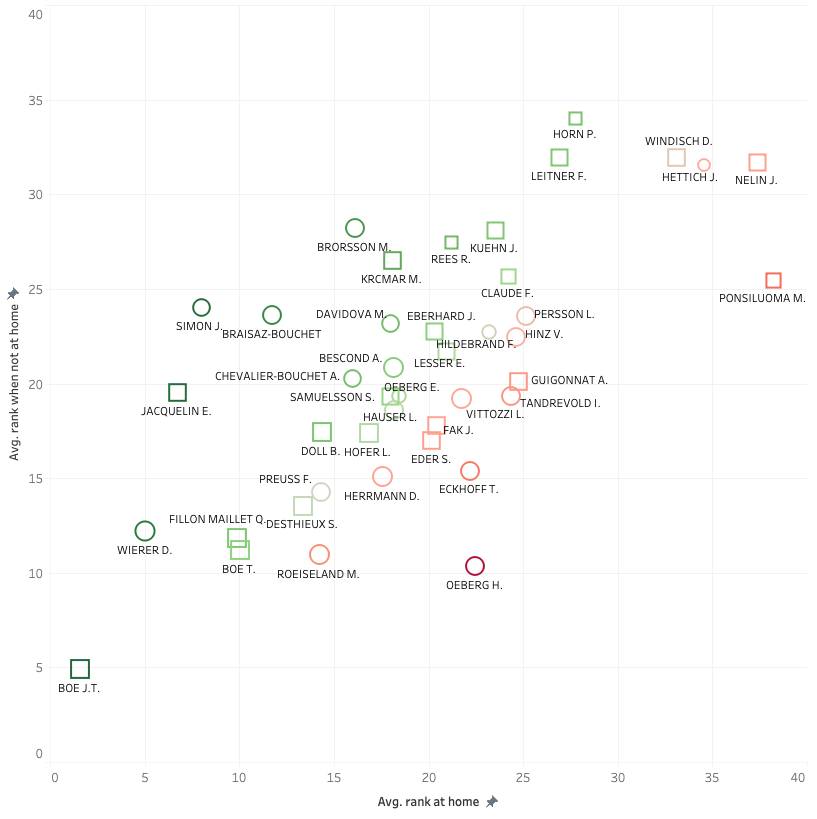
Analyzing the impact of home crowds and venues on biathletes performances
Biathlon Insider #11 content
Biathlon Insider #11 content
An analysis of the always exciting pursuit races
An analysis of the always exciting pursuit races.
Looking back at Oestersund through data
With Oestersund coming to a close, it is time to review the Women’s individual performances based on the race data.
Getting pumped for the new Biathlon season?
A quick re-run of the last race of last season, by ranking
Will Laegreid experience a Sophomore Slump or continue his amazing pace?
Will Laegreid experience a Sophomore Slump or continue his amazing pace?
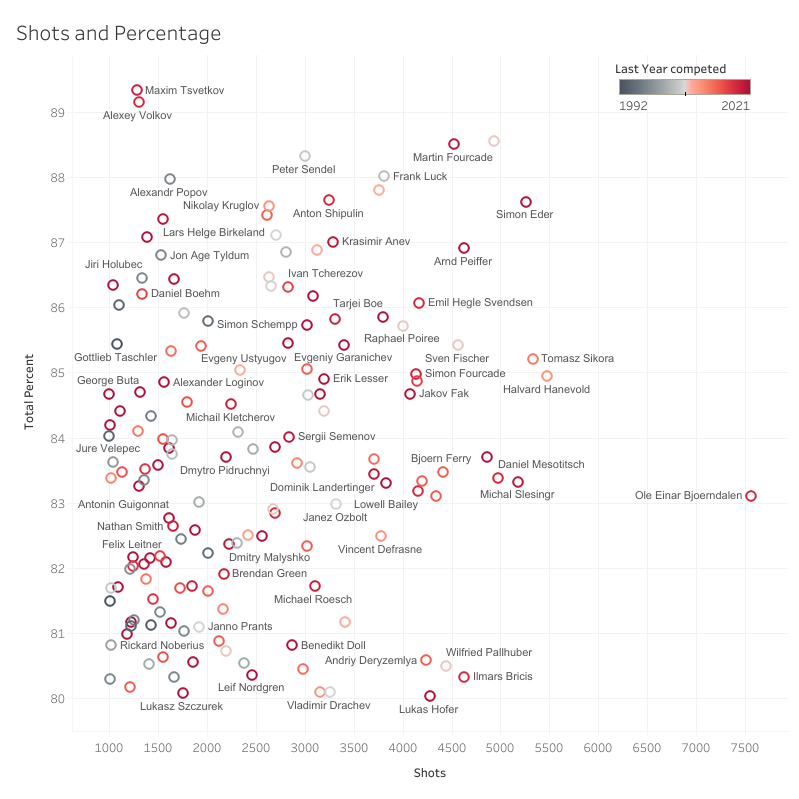
Shooting Prone -vs- Standing. Which is better?

An analysis of prone vs standing shooting
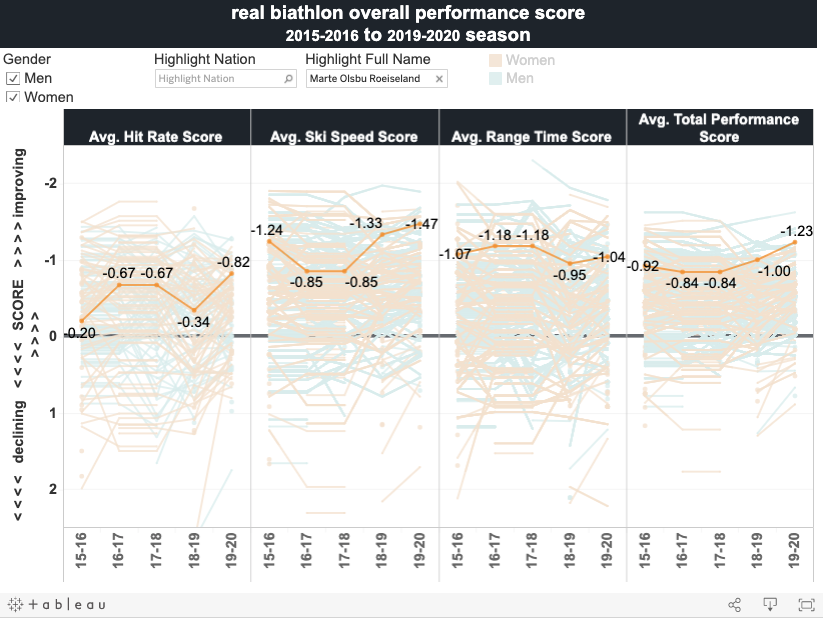
Athletes to look out for in the new season
This article looks at the new biathlon season using the Performance Score, which is explained in detail on RealBiathlon’s website. In short, it uses Ski speed, shooting speed and shooting accuracy in comparison to other athletes to eventually come to an indicator that shows if someone had a good race, disconnected from the actual results. It is important to know that a negative value is good, meaning faster skiing and shooting and better shooting. So remember: – = good And we should also set some references on what is good and what is not so good when it comes to…
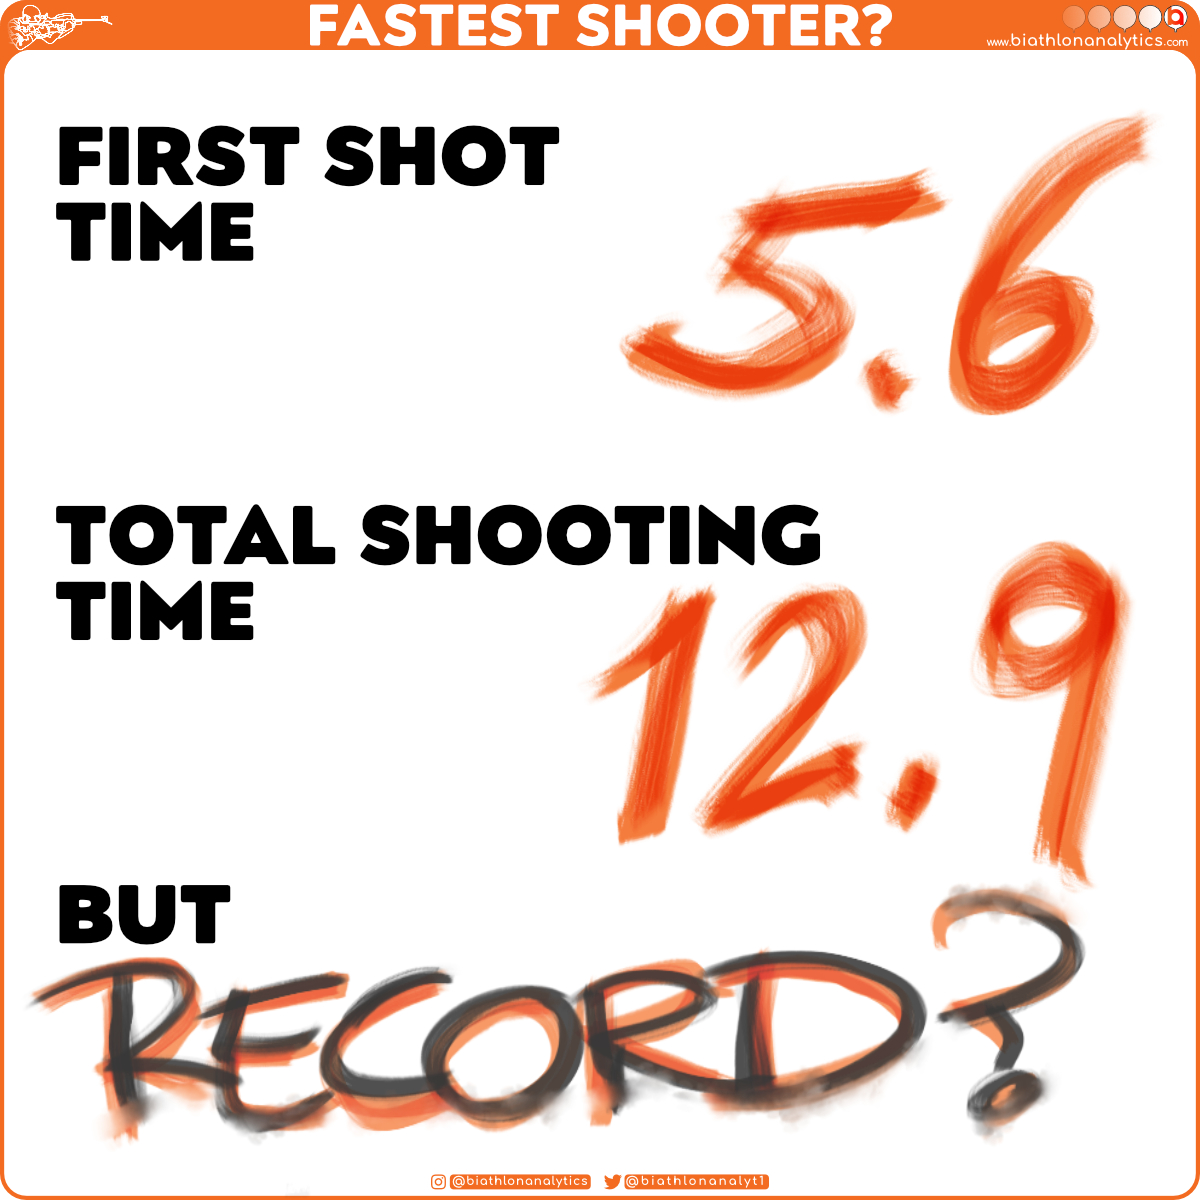
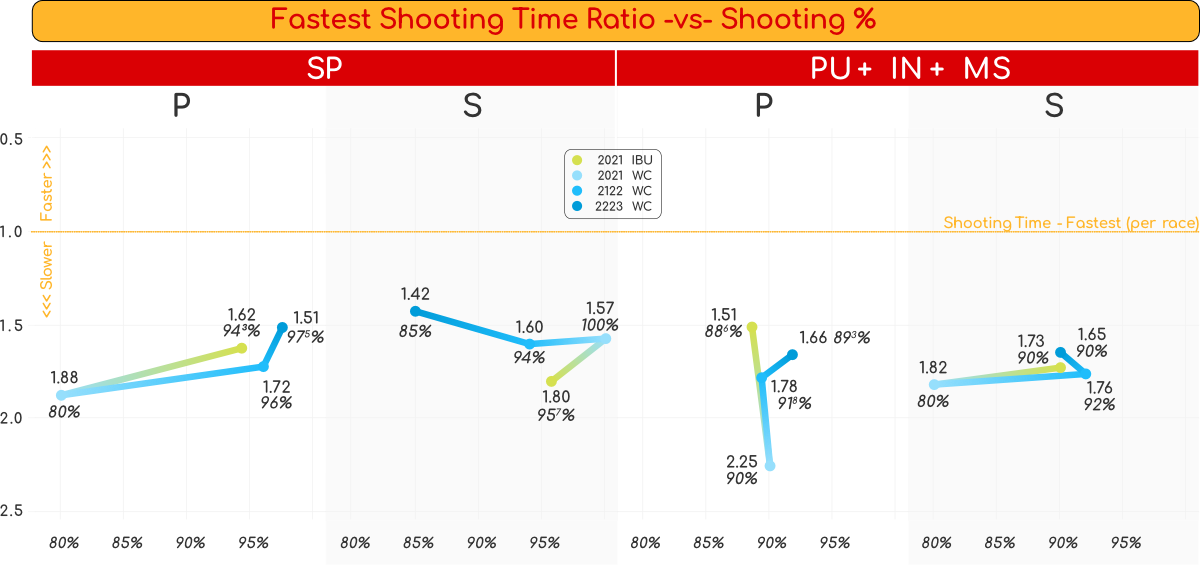
Are they shooting faster than their shadows?
If you grew up with comic books like me, you may have heard of Lucky Luke, the cowboy who could shoot faster than his shadow: And when I think of fast shooting, I cannot think of anything else than Emilien Jacquelin’s standing shooting at the last World Championships, I believe it was the pursuit race: You may remember from earlier posts that I am not Jacquelin’s biggest fan by any stretch, but that doesn’t mean you can’t appreciate and respect something incredible! Anyway, it made me wonder about shooting times and how they possibly have changed in the last decade…
Eder's unbelievable clean shooting streak in biathlon
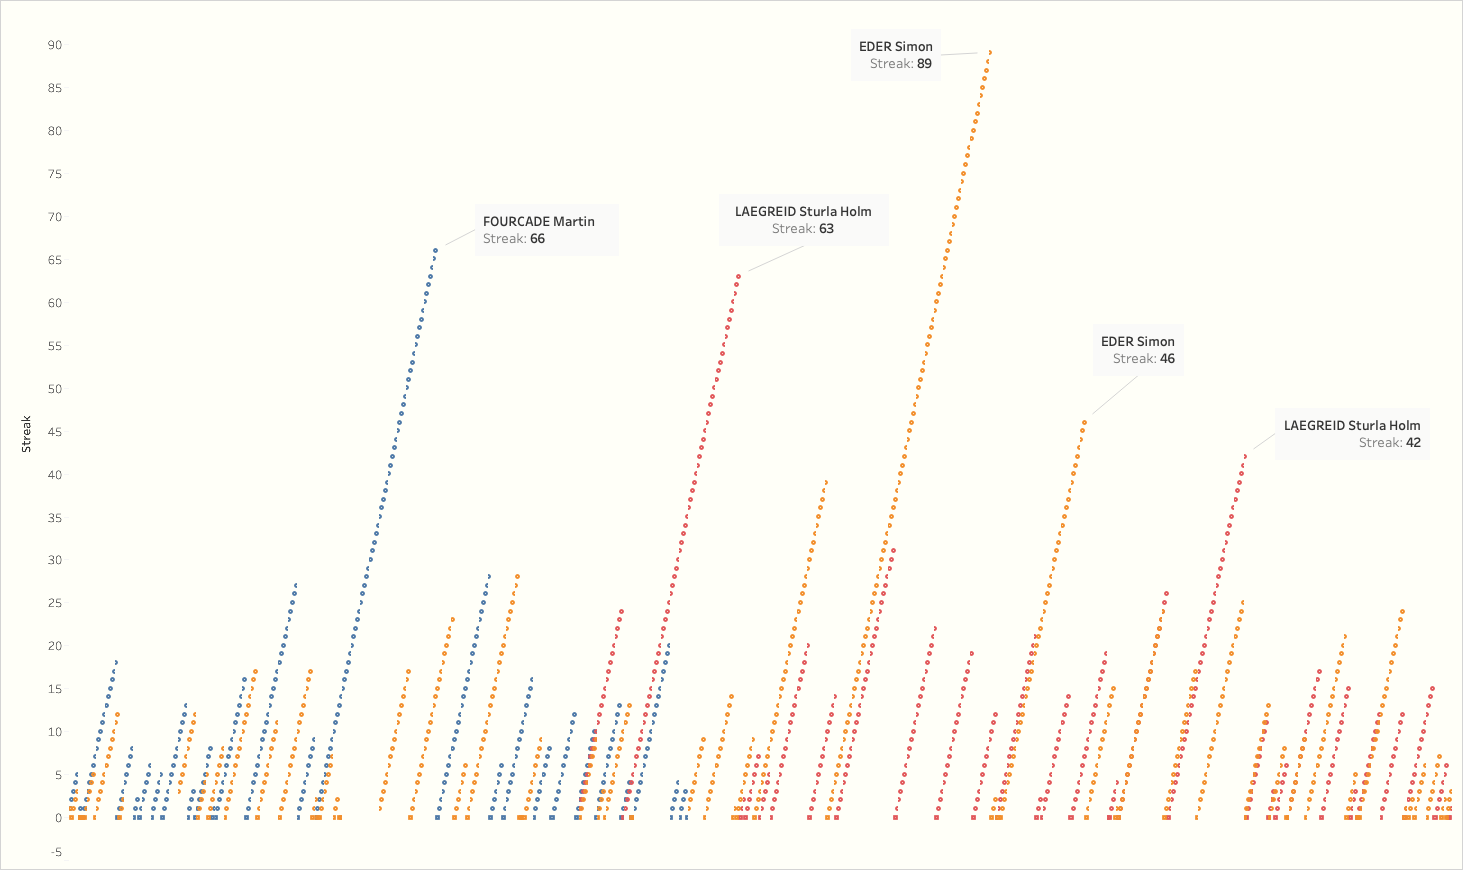
A (re-)view of Simon Eder’s unbelievable shooting streak of 89 hits in a row; 99 when including Relays!
Points per Race Continuation, part II
Looking at the women’s outliers for next season.
Points per Race Continuation
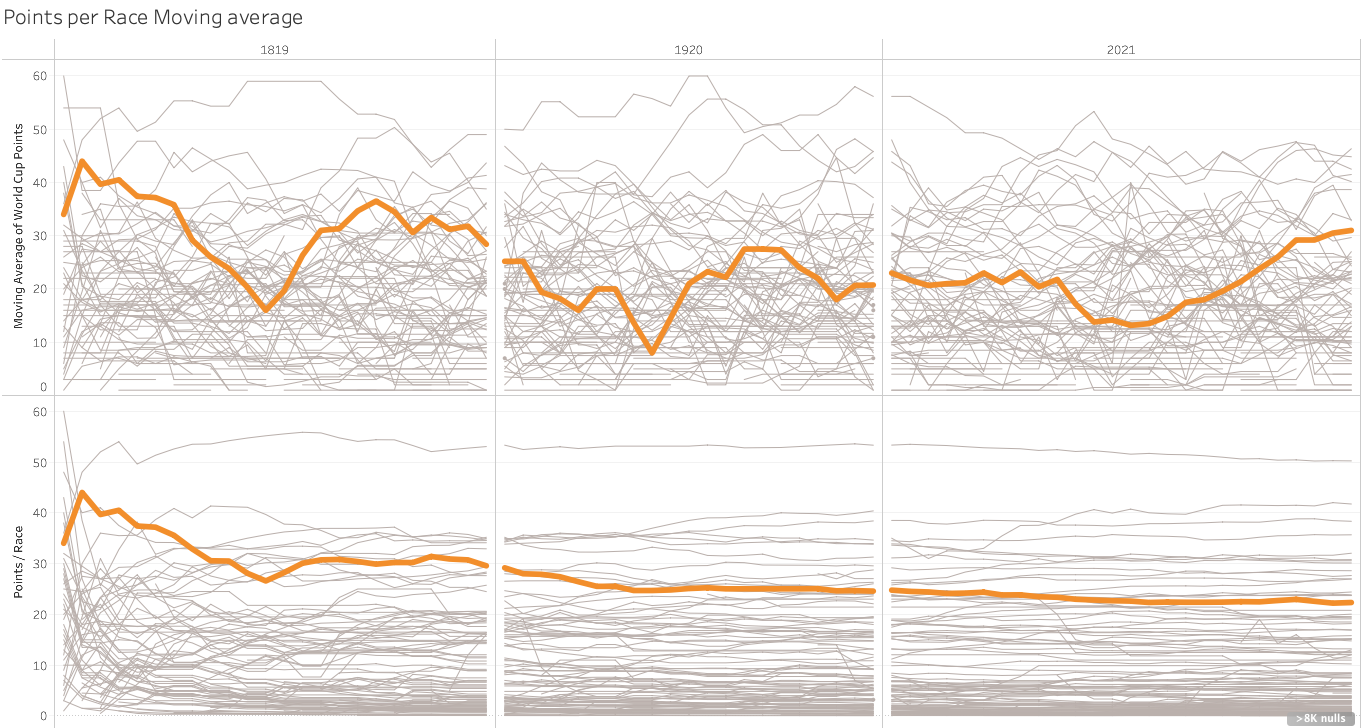
As the biathlon summer events are coming and going, it is time to look at the upcoming (winter) season!
New functionality on RealBiathlon
The RealBiathlon website has a new feature; you should check it out
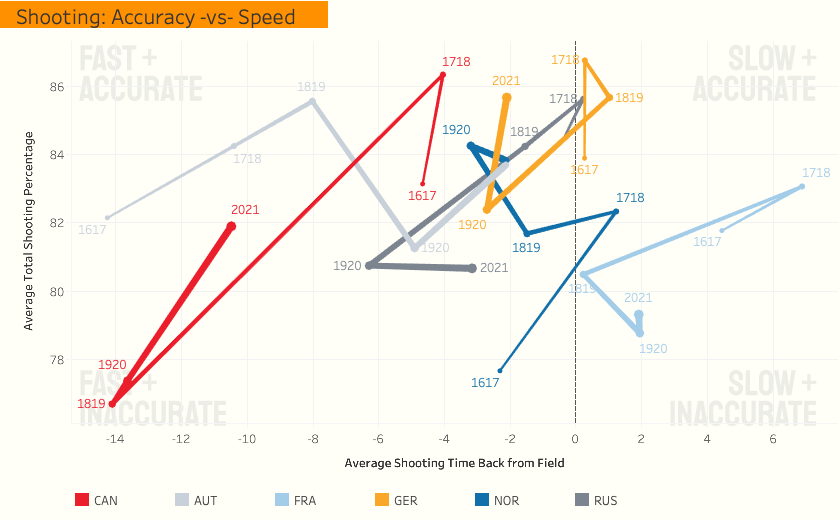
Why the French weren't more competitive
While the French are better performers in the shooting range, the increasing gap in ski speed kept them from challenging for the yellow bib last season.
Predicting race results
I ran into a website that has built a model to predict race and season outcomes, and their results are interesting, to say the least.
Why you should check out Real Biathlon
An article on why checking out Real biathlon’s website and data is a good idea
Is analytical comparison on your radar?
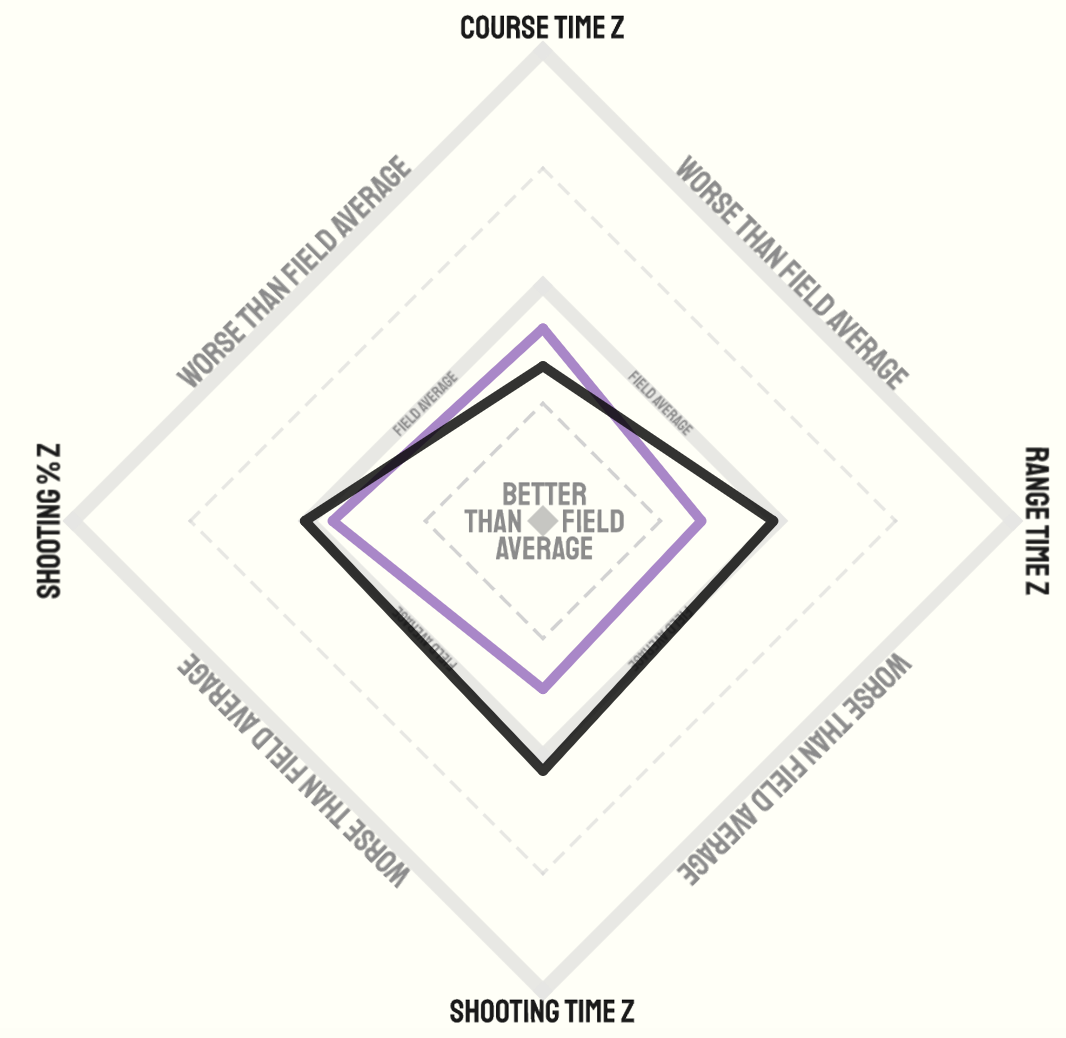
An article about using Radar charts for comparing statistics.
A follow-up on going the distance.
More evidence that the IBU doesn’t watch the race distances too closely.
It's all for the money. Or is it?
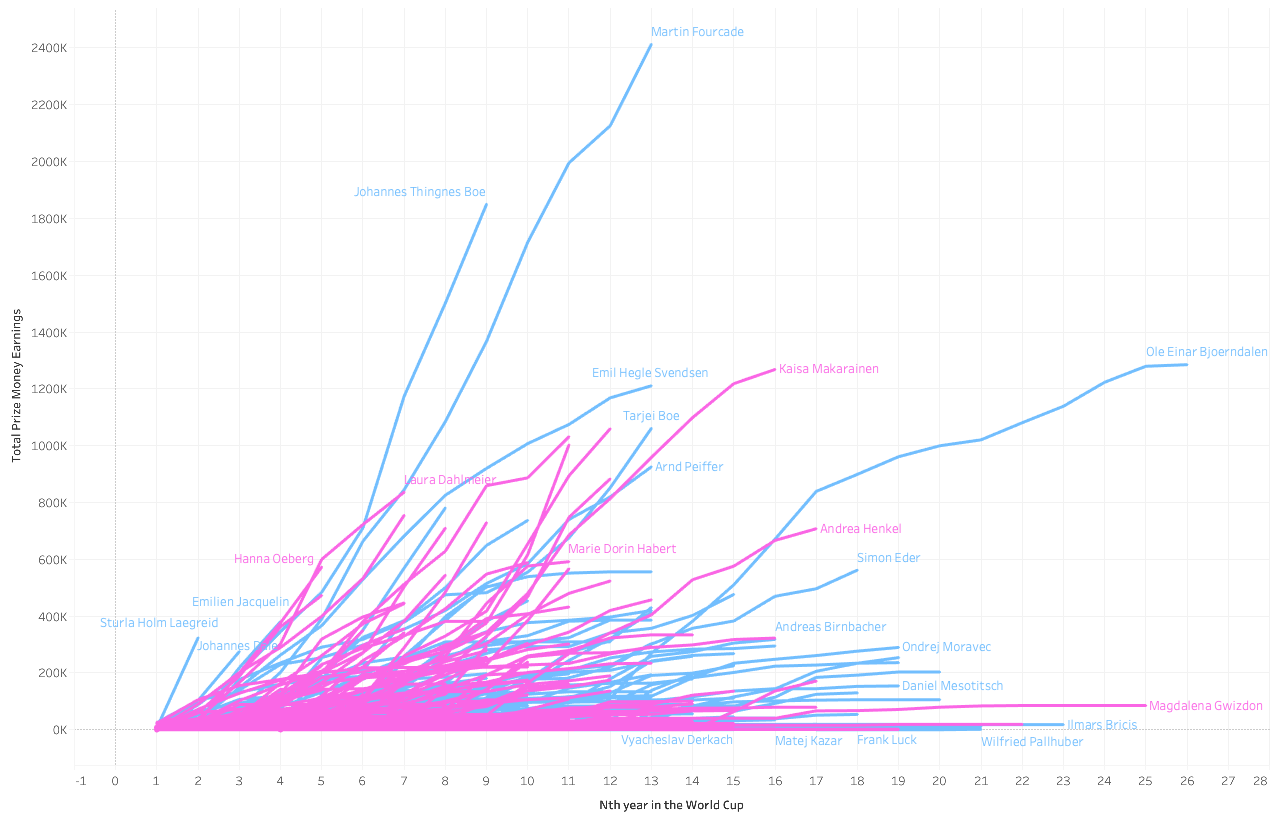
An exploration of the new Prize Money data set.
Canadian biathletes finding balance
Team Canada is finding a balance for speed and accuracy, while continuing to decrease the gap in skiing speed
Wierer in pursuit… of my mind
We have some data after all to show that Wierer performs better when further behind in Pursuit
Stina, look at what you made me do!
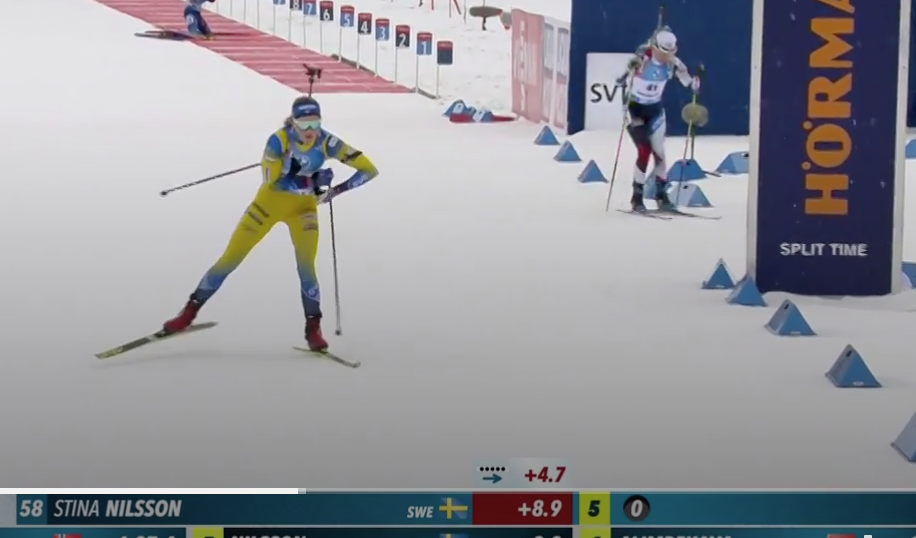
Do we have enough data to say something about Preparation time?
Women's field narrows but men's stays the same
This analysis looks at the narrowing or broadening gap between performances in non-team biathlon races since the 2009-2010 season.
LUKI -vs- SEB, the tightest sprint race you'll ever see
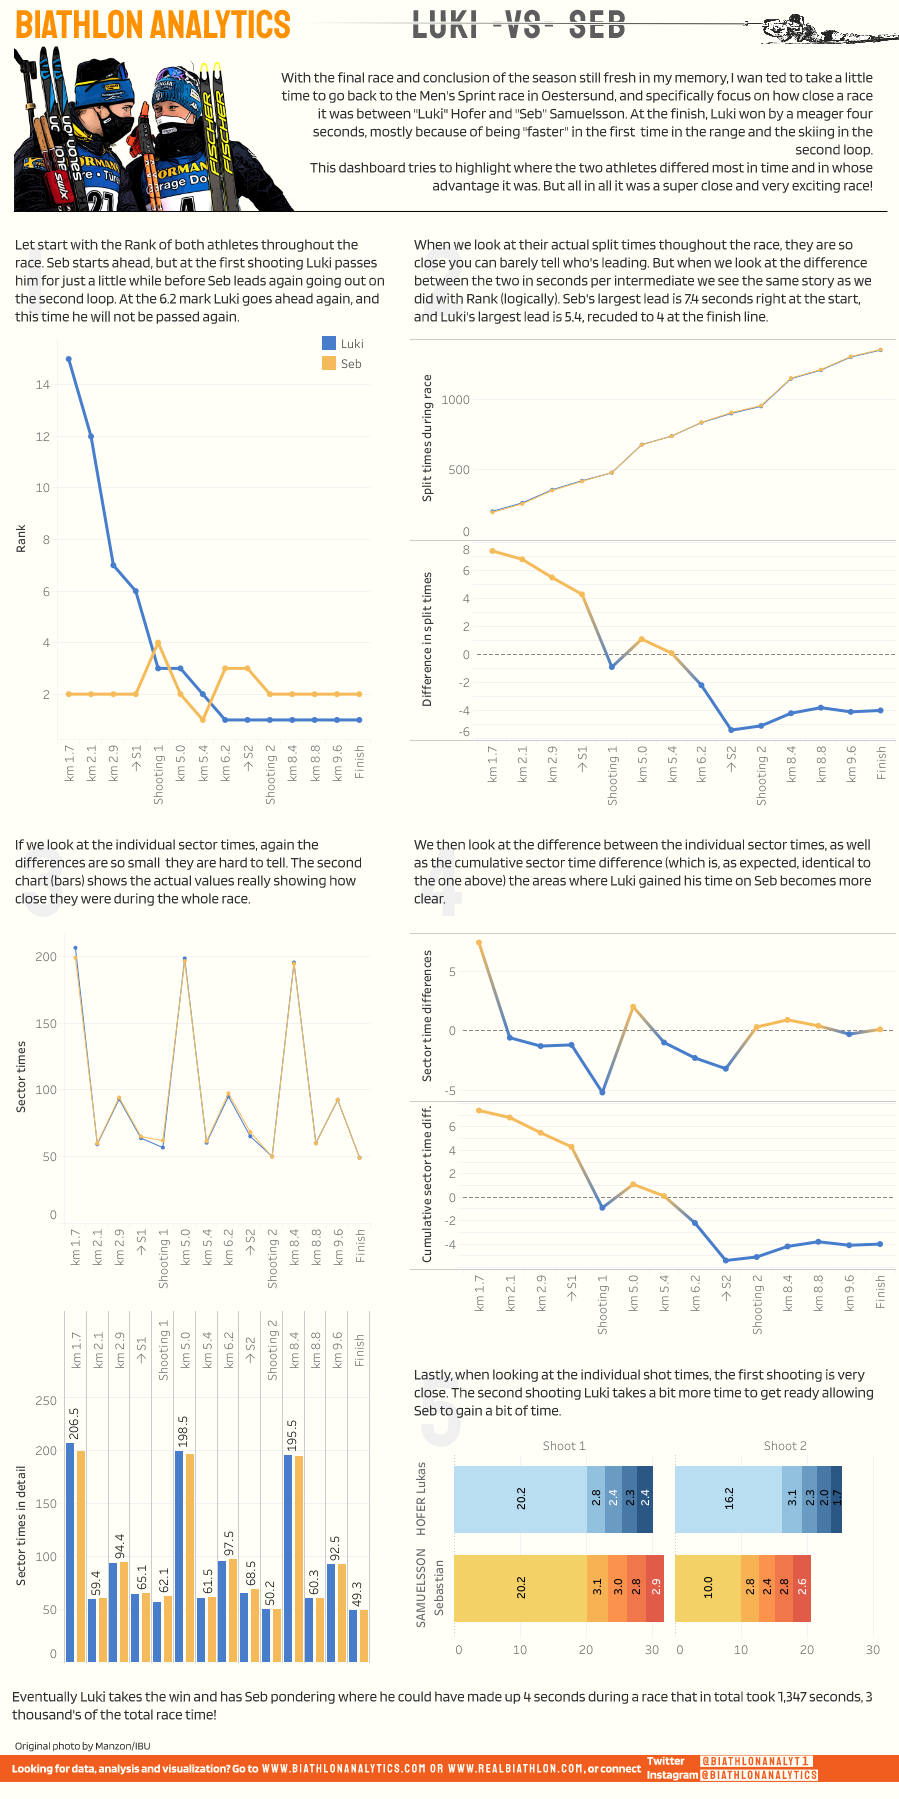
A closer look at the Oestersund Sprint race between Luki Hofer and Seb Samuelsson
Number of winning athletes doubles in super exciting season
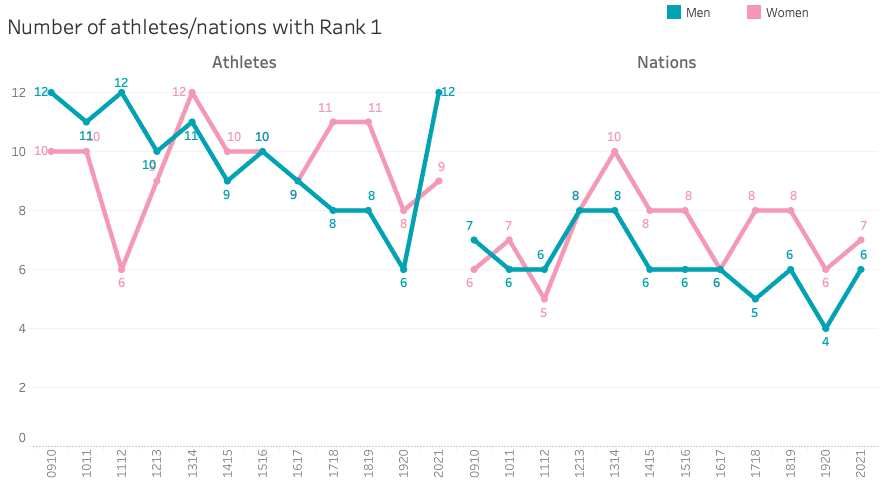
When looking at athletes and Nations representing the top places in biathlon we see some promising increases for the athletes, but a somewhat concerning image for the Nations.
Is the IBU going the distance?
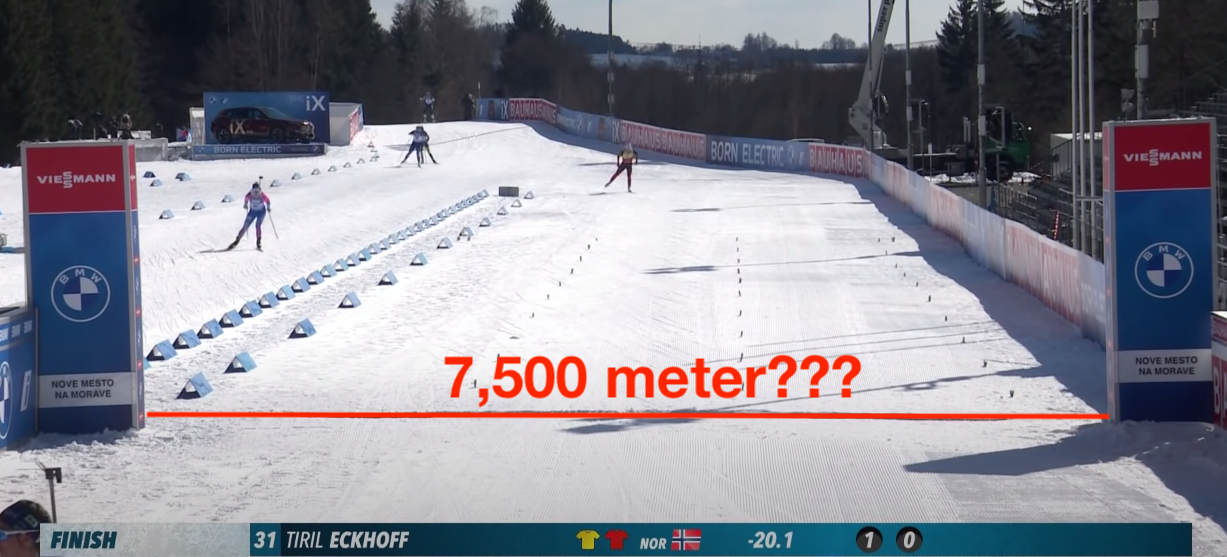
Are the biathlon race courses that actual distance they say they are? A quick research into Women’s Sprints race lengths.
Wierer's Pursuit efforts and results
Does starting later in the pursuit lead to better results? This article analyses the data for Dorothea Wierer to find out.
How the tracks are made for SKOOT the biathlon game
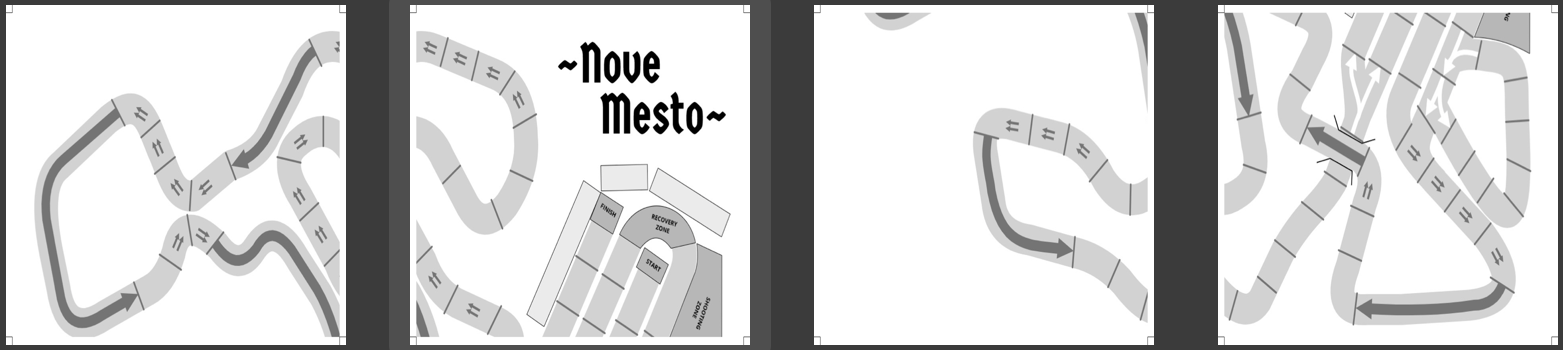
This is a short post about how I create the tracks for the Biathlon board game SKOOT I developed.
Exploring Biathlon Relay race data
An exploration of Biathlon Relay Race data
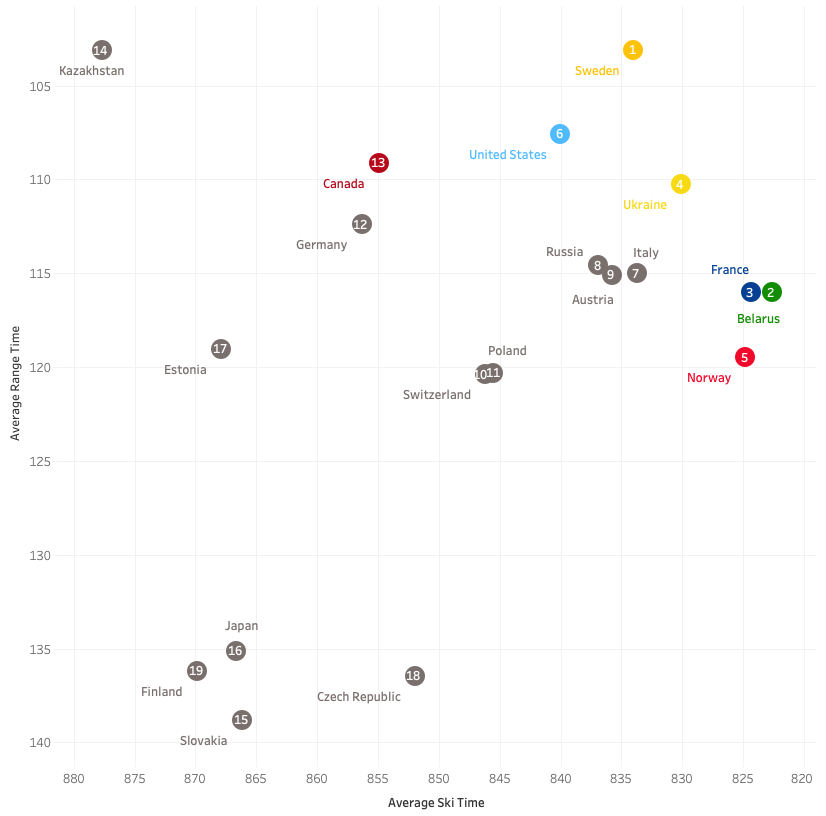
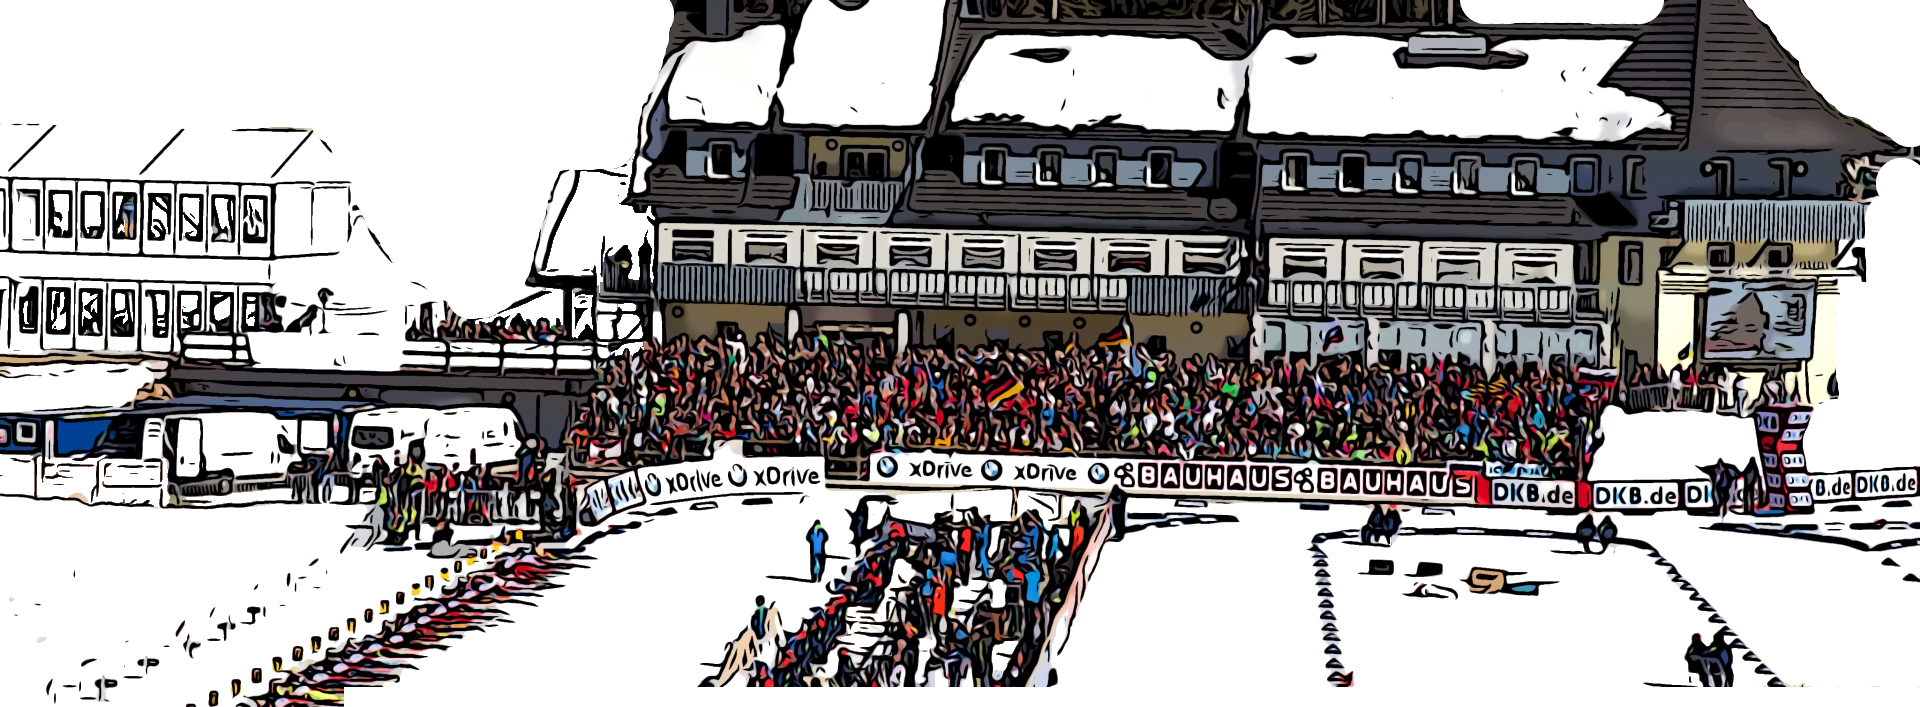
Pokljuka Mass Start Men in Comic form
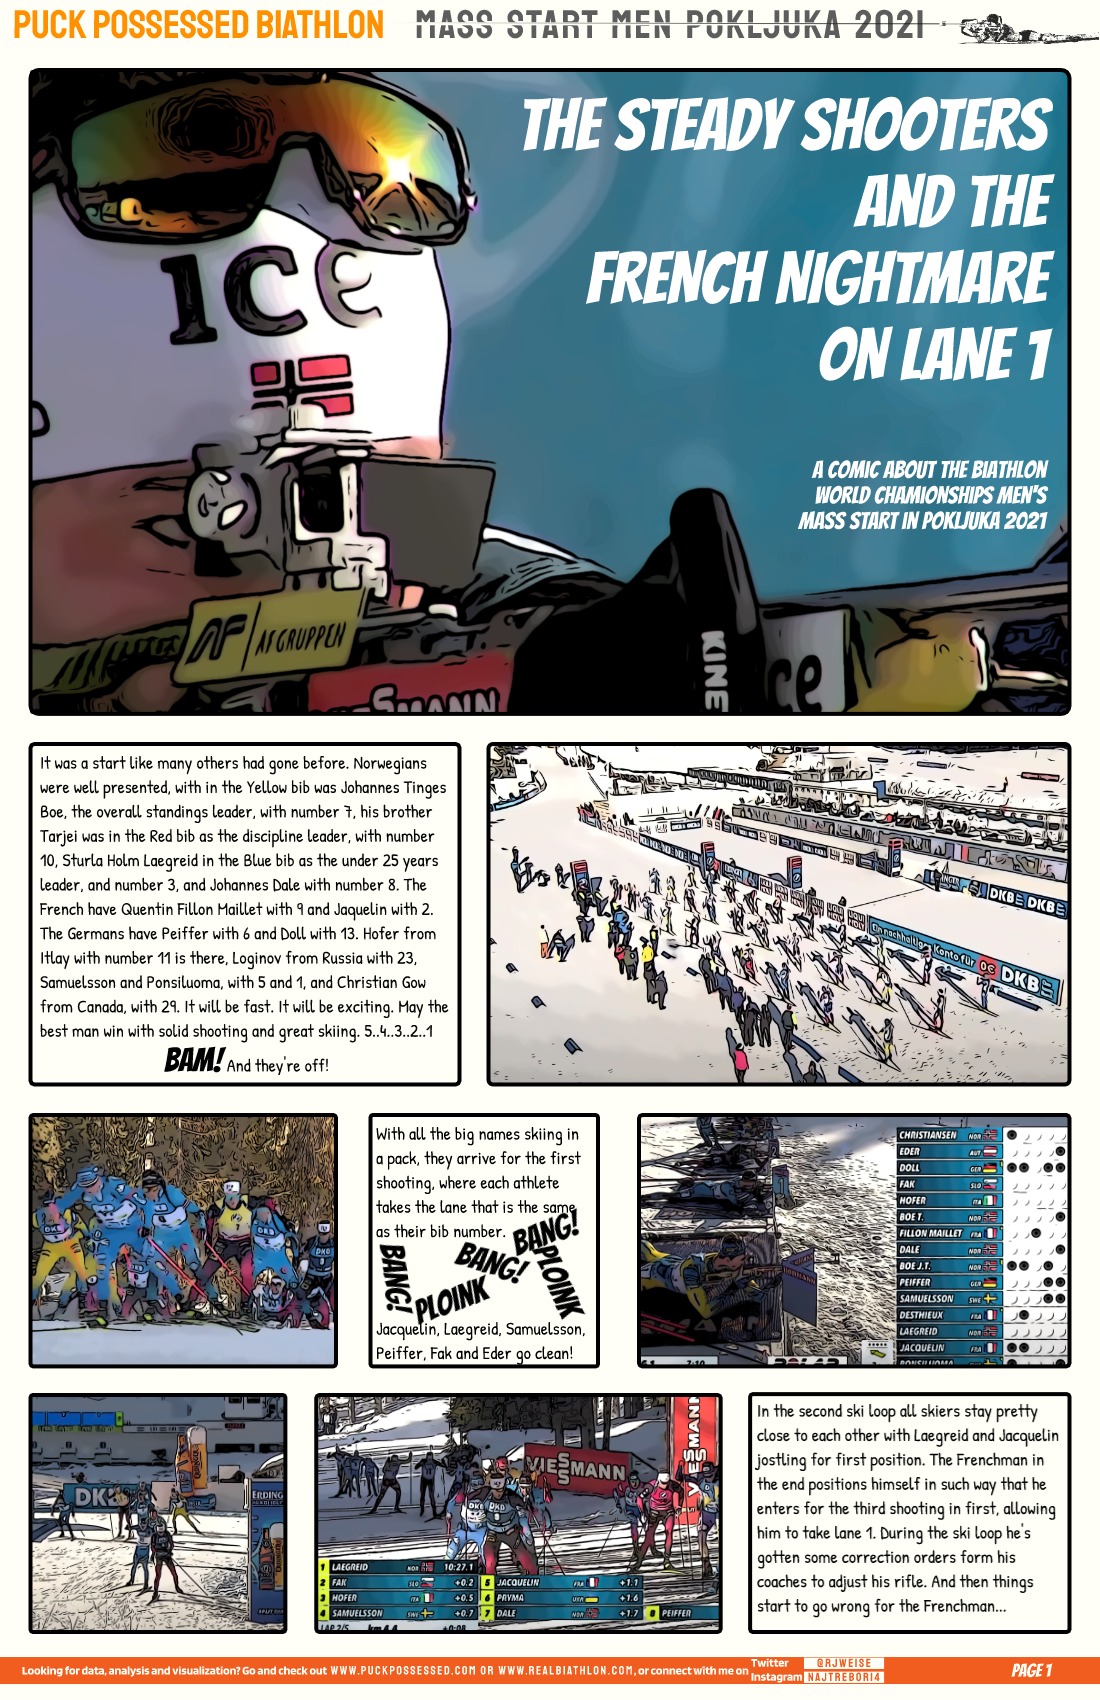
A replay of the Men’s Mass Start at the Biathlon World Championships in Pokljuka 2021
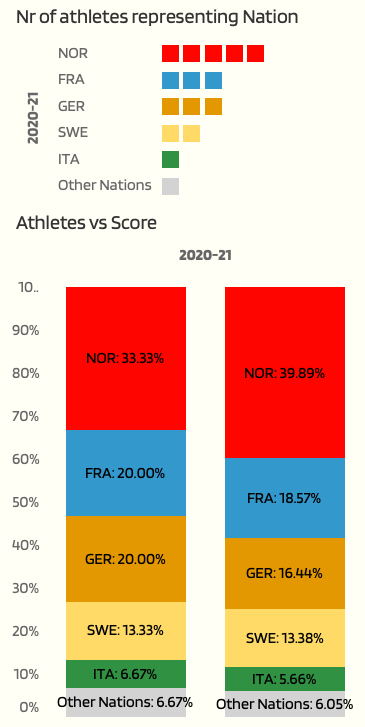
North American Successes at the Biathlon World Championships in Pokljuka 2021
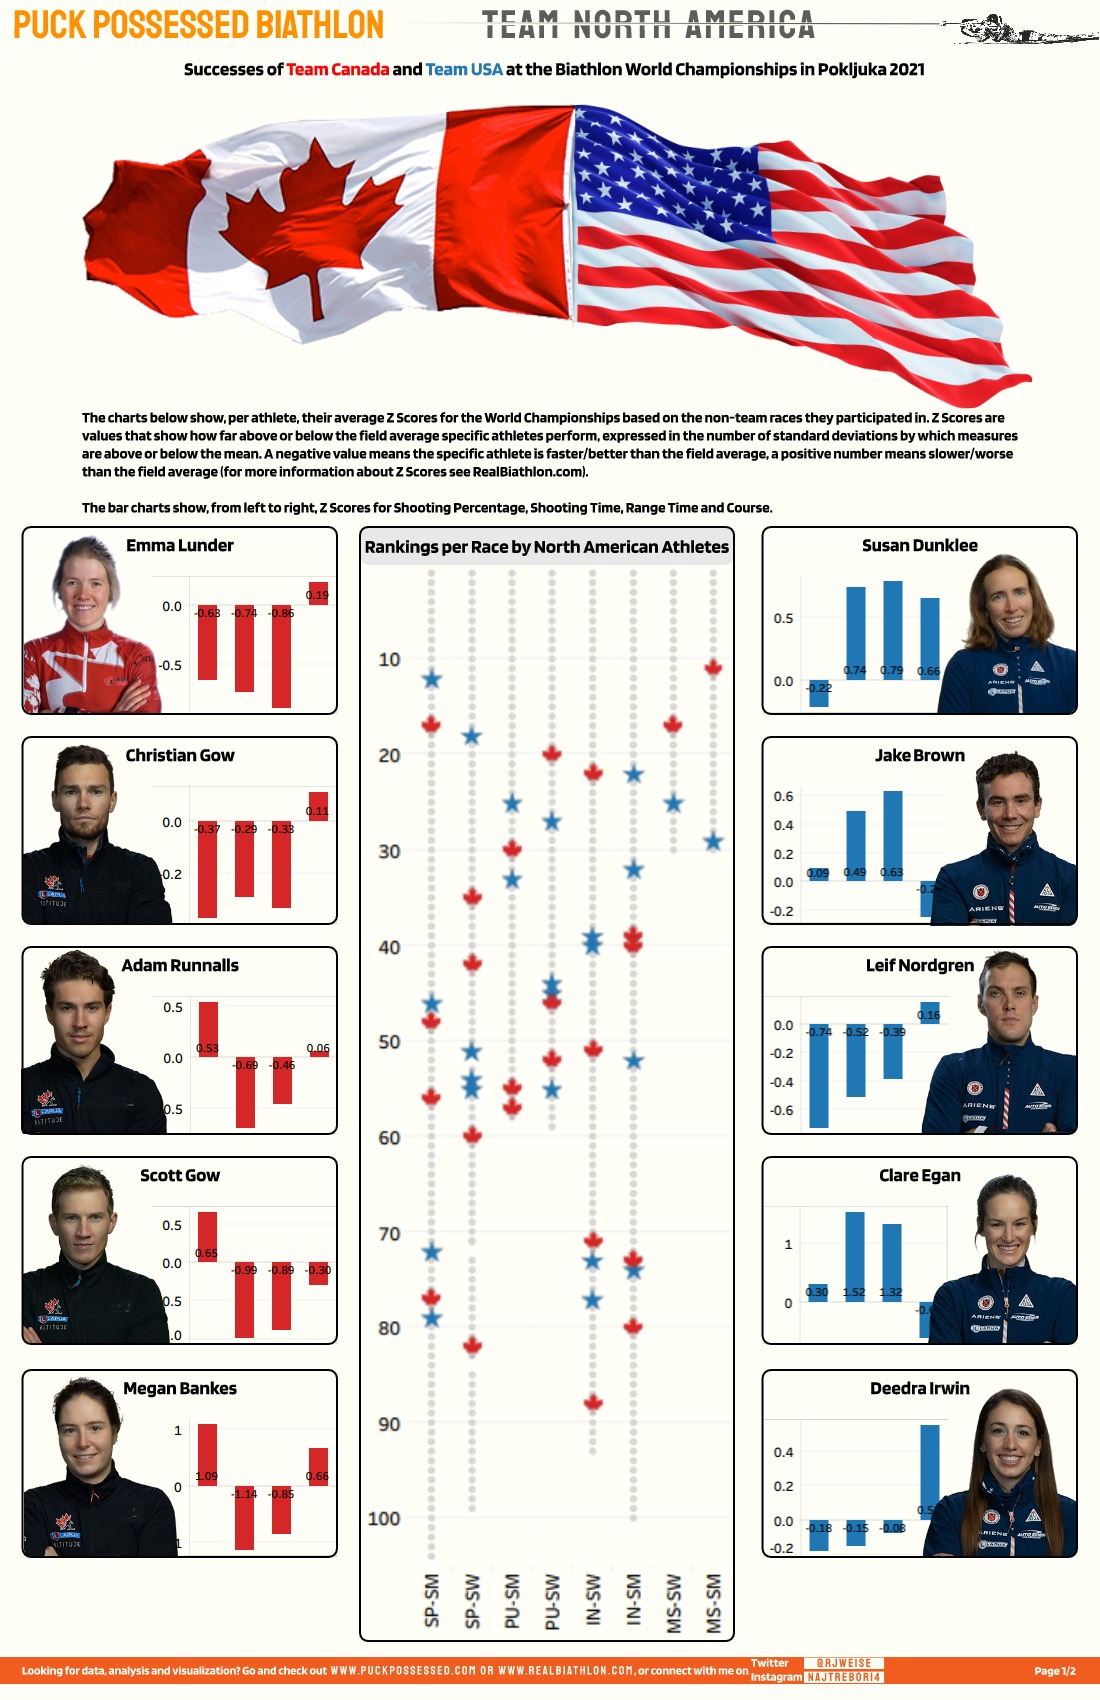
North American Successes at the Biathlon World Championships in Pokljuka 2021
When to start?
A research project about when to start in individual and sprint races based on impact of conditions.
Predicting the World Championships in Pokljuka
Not a true predictor, but a tool providing information to make a better-informed prediction quicker
Sturla Holm Lægreid
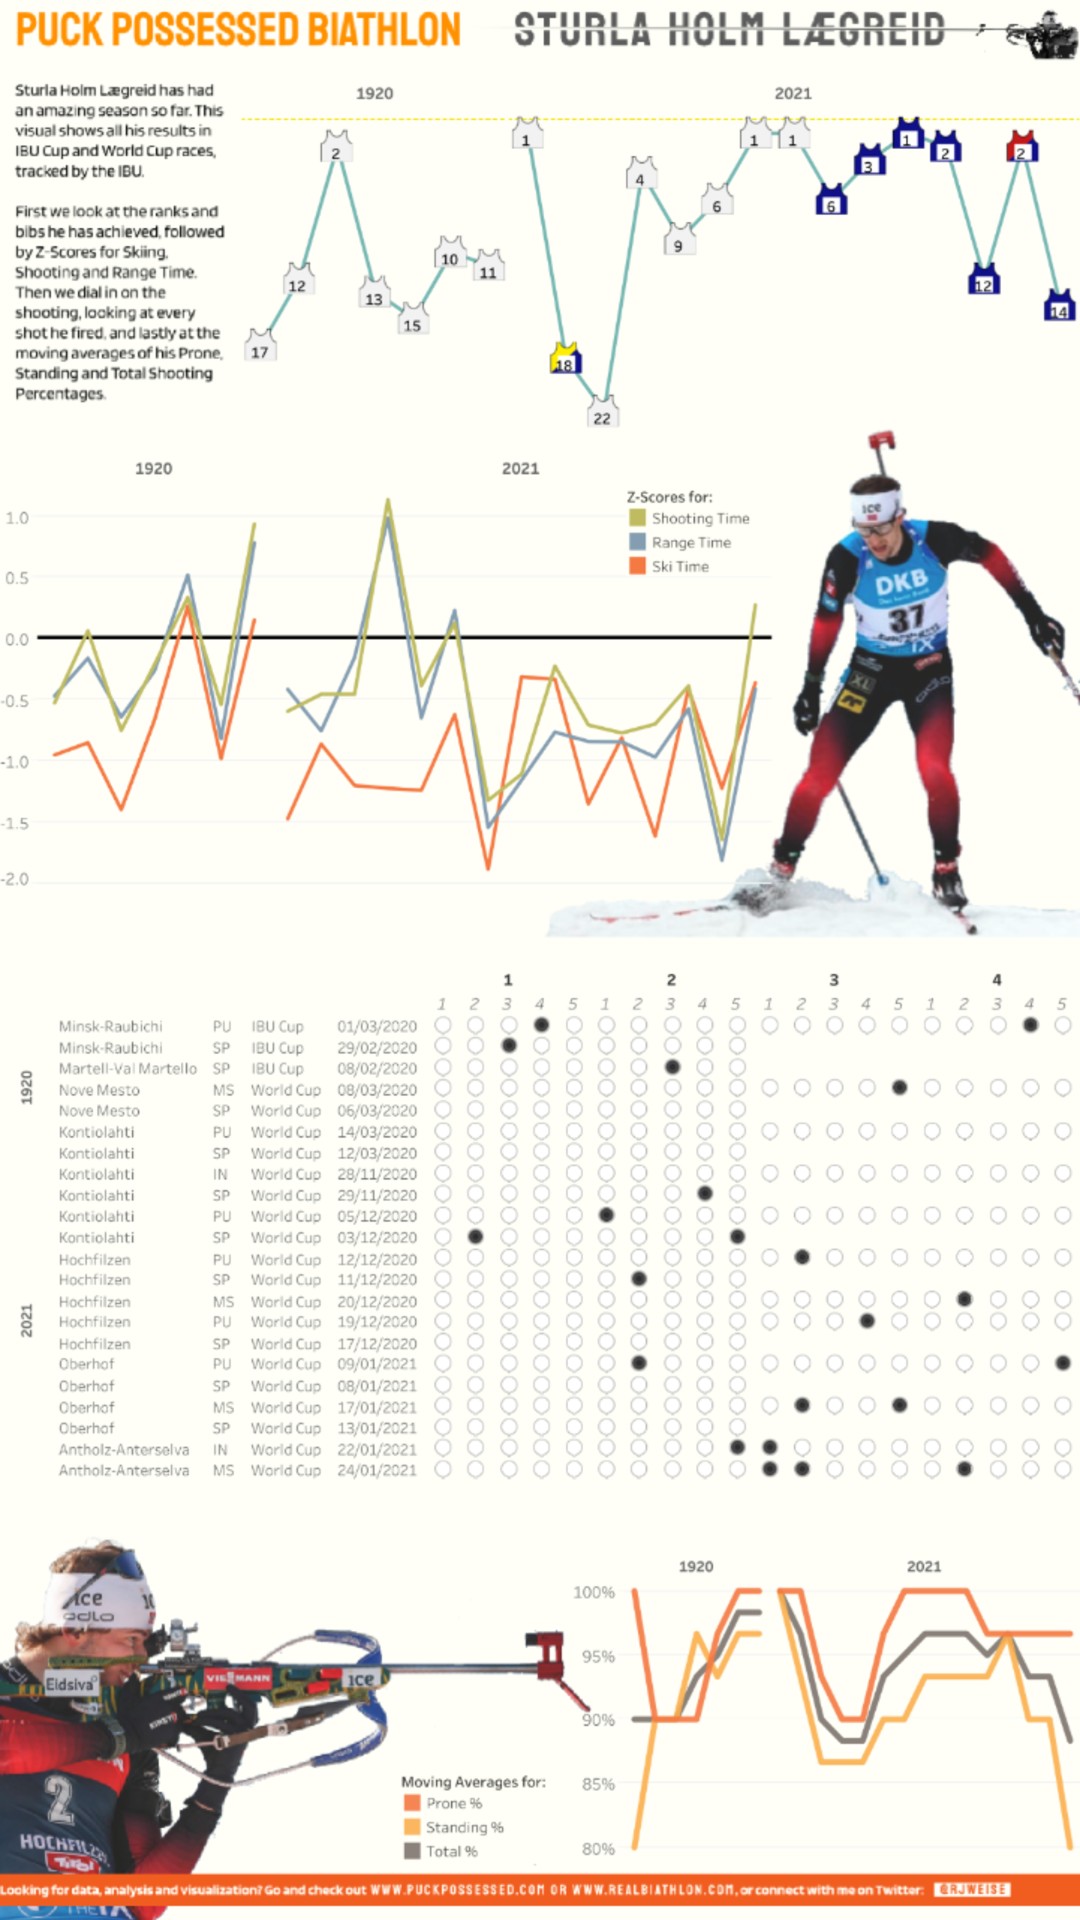
A Sturla Holm Lægreid Special
IBU -vs- WorldCup Performance, part I
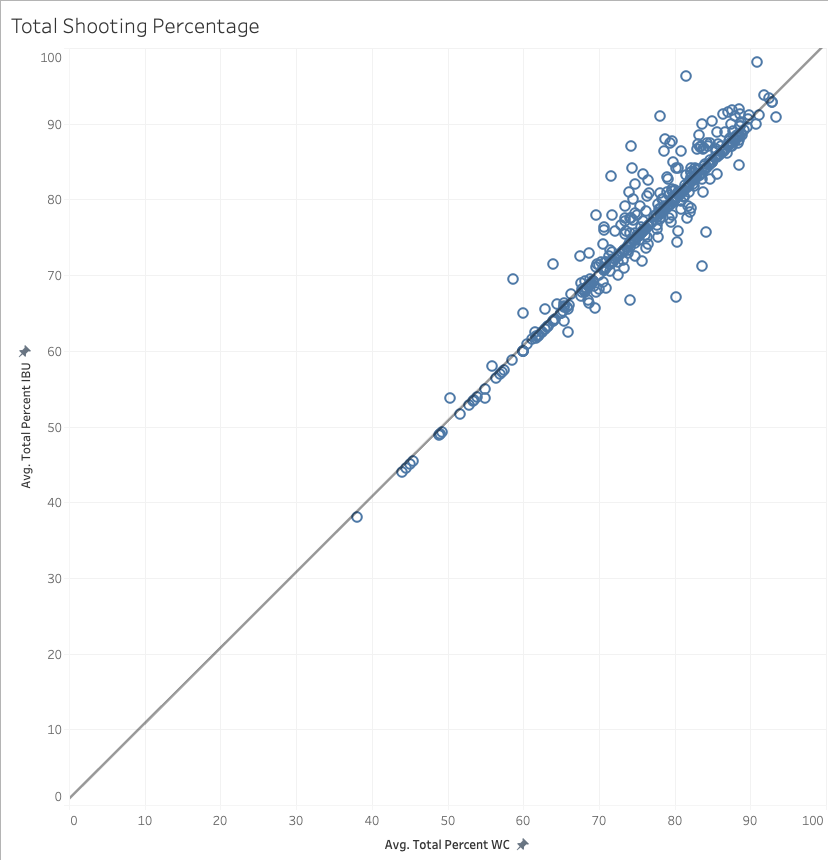
A comparison of metrics for athletes that competed at both the IBU as well as the World Cup level
The Consistency of Consistency
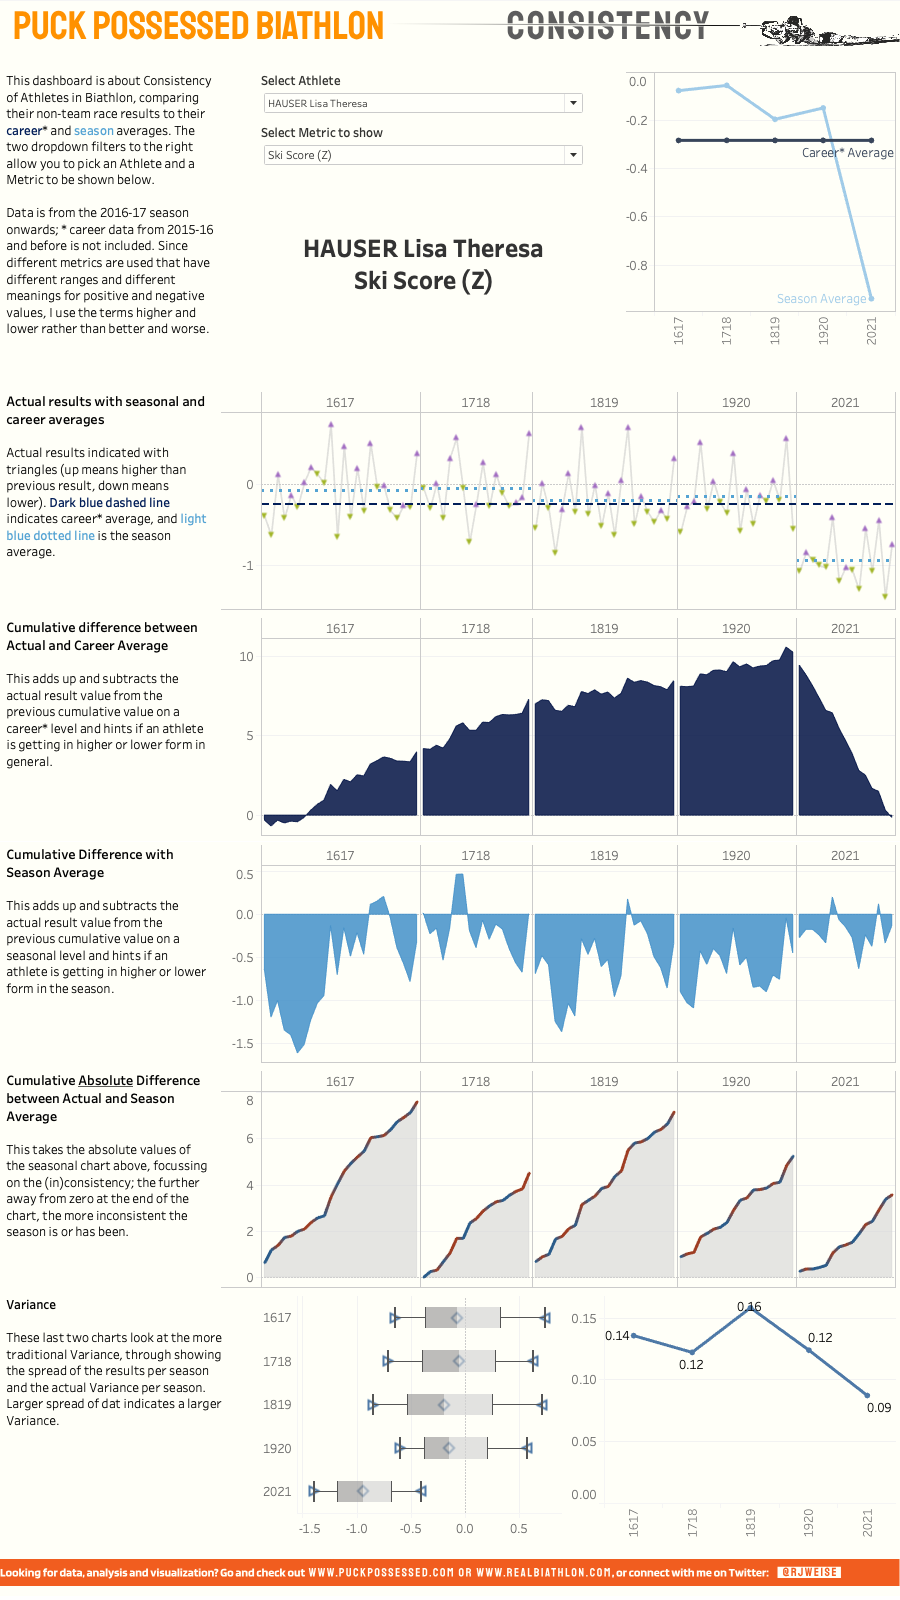
A tool to further research an athletes’ performances, form, and consistency in Biathlon
Norwegian Dominance
Leistungs Dichtheit, which I would translate as Proximity of Performance; how close to each other are athletes from the same nation in the world cup rankings?
"Whether the weather is better or worse, the race is still always made on the course".
A re-do with far more data of the “Impact of external factors on shooting performance in biathlon”
Fehlerfrei – a quick article on shooting clean
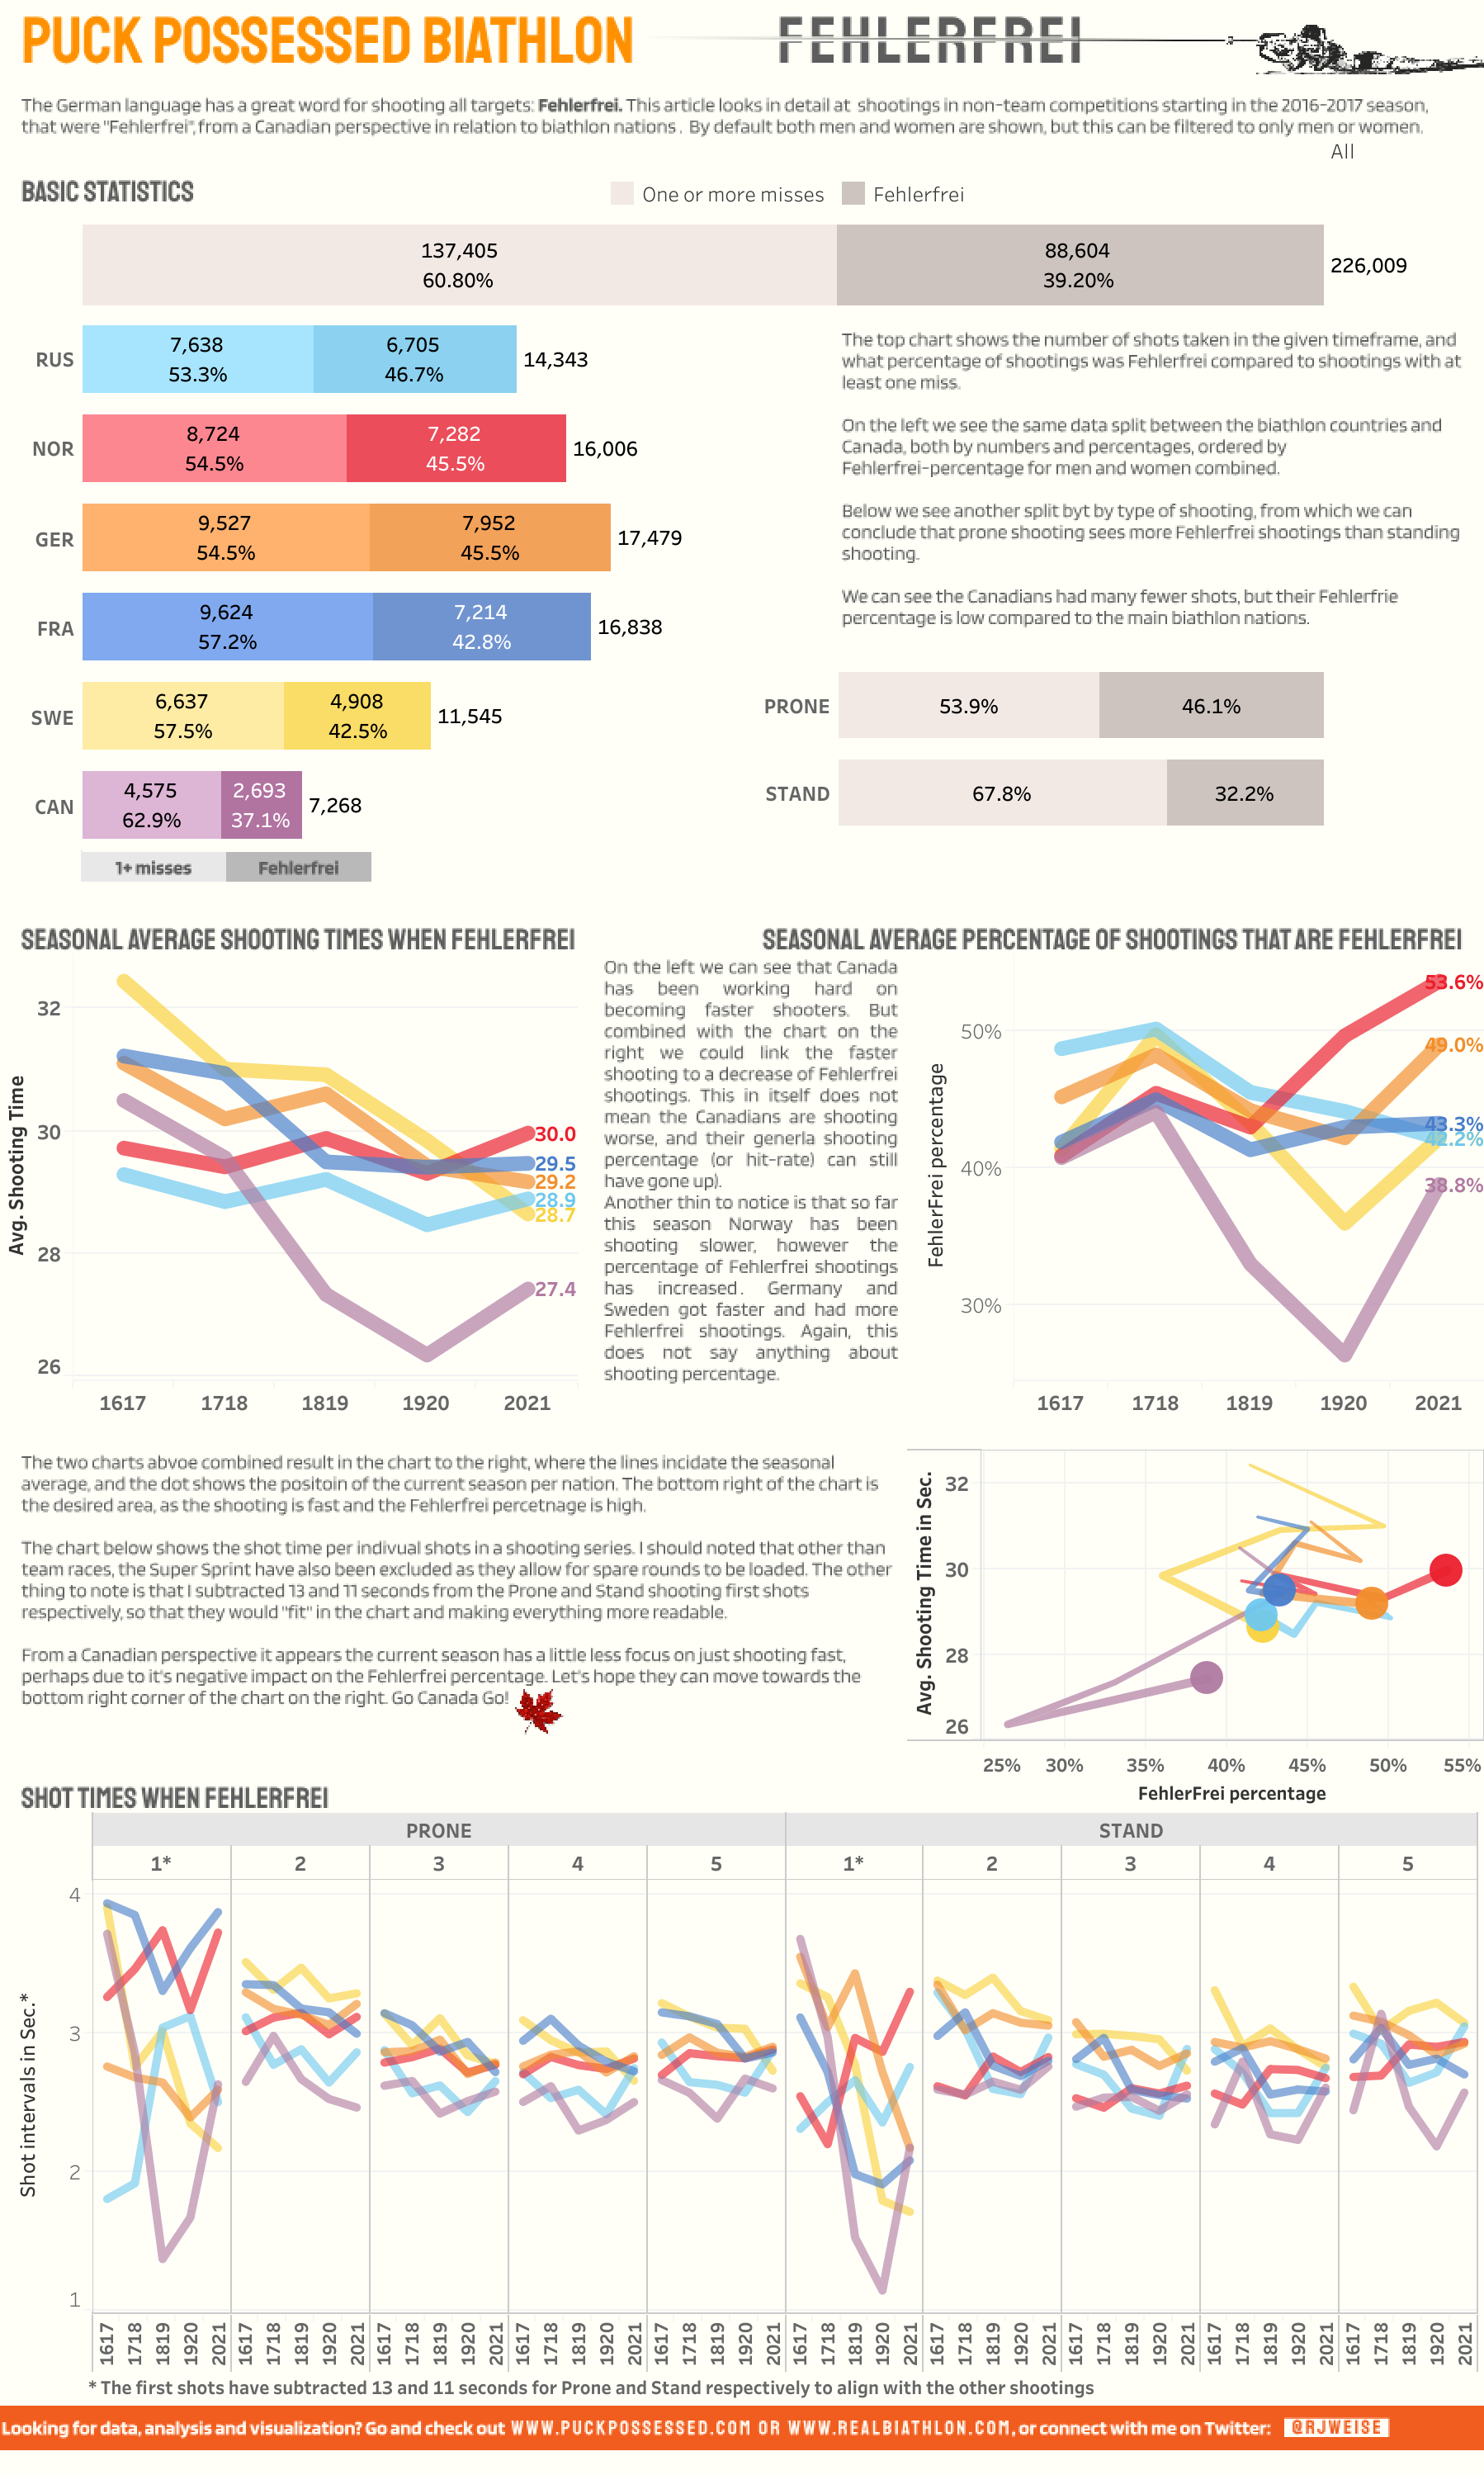
The Germans have a great word they use for shooting clean in biathlon: Fehlerfrei. The visual below is a brief look into shooting Fehlerfrei and how it relates to shooting and shot times.
Biathlon Analysis Videos on German TV
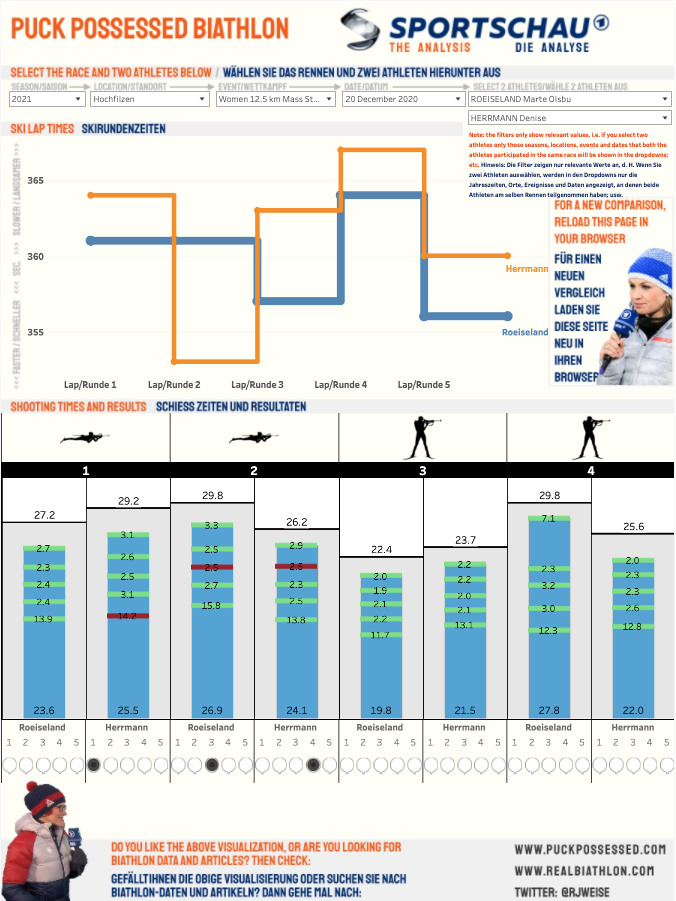
A report allowing users to analyze races by comparing two athletes on ski speed and shooting speed and accuracy.
How did the competitive (ski) level change in biathlon?
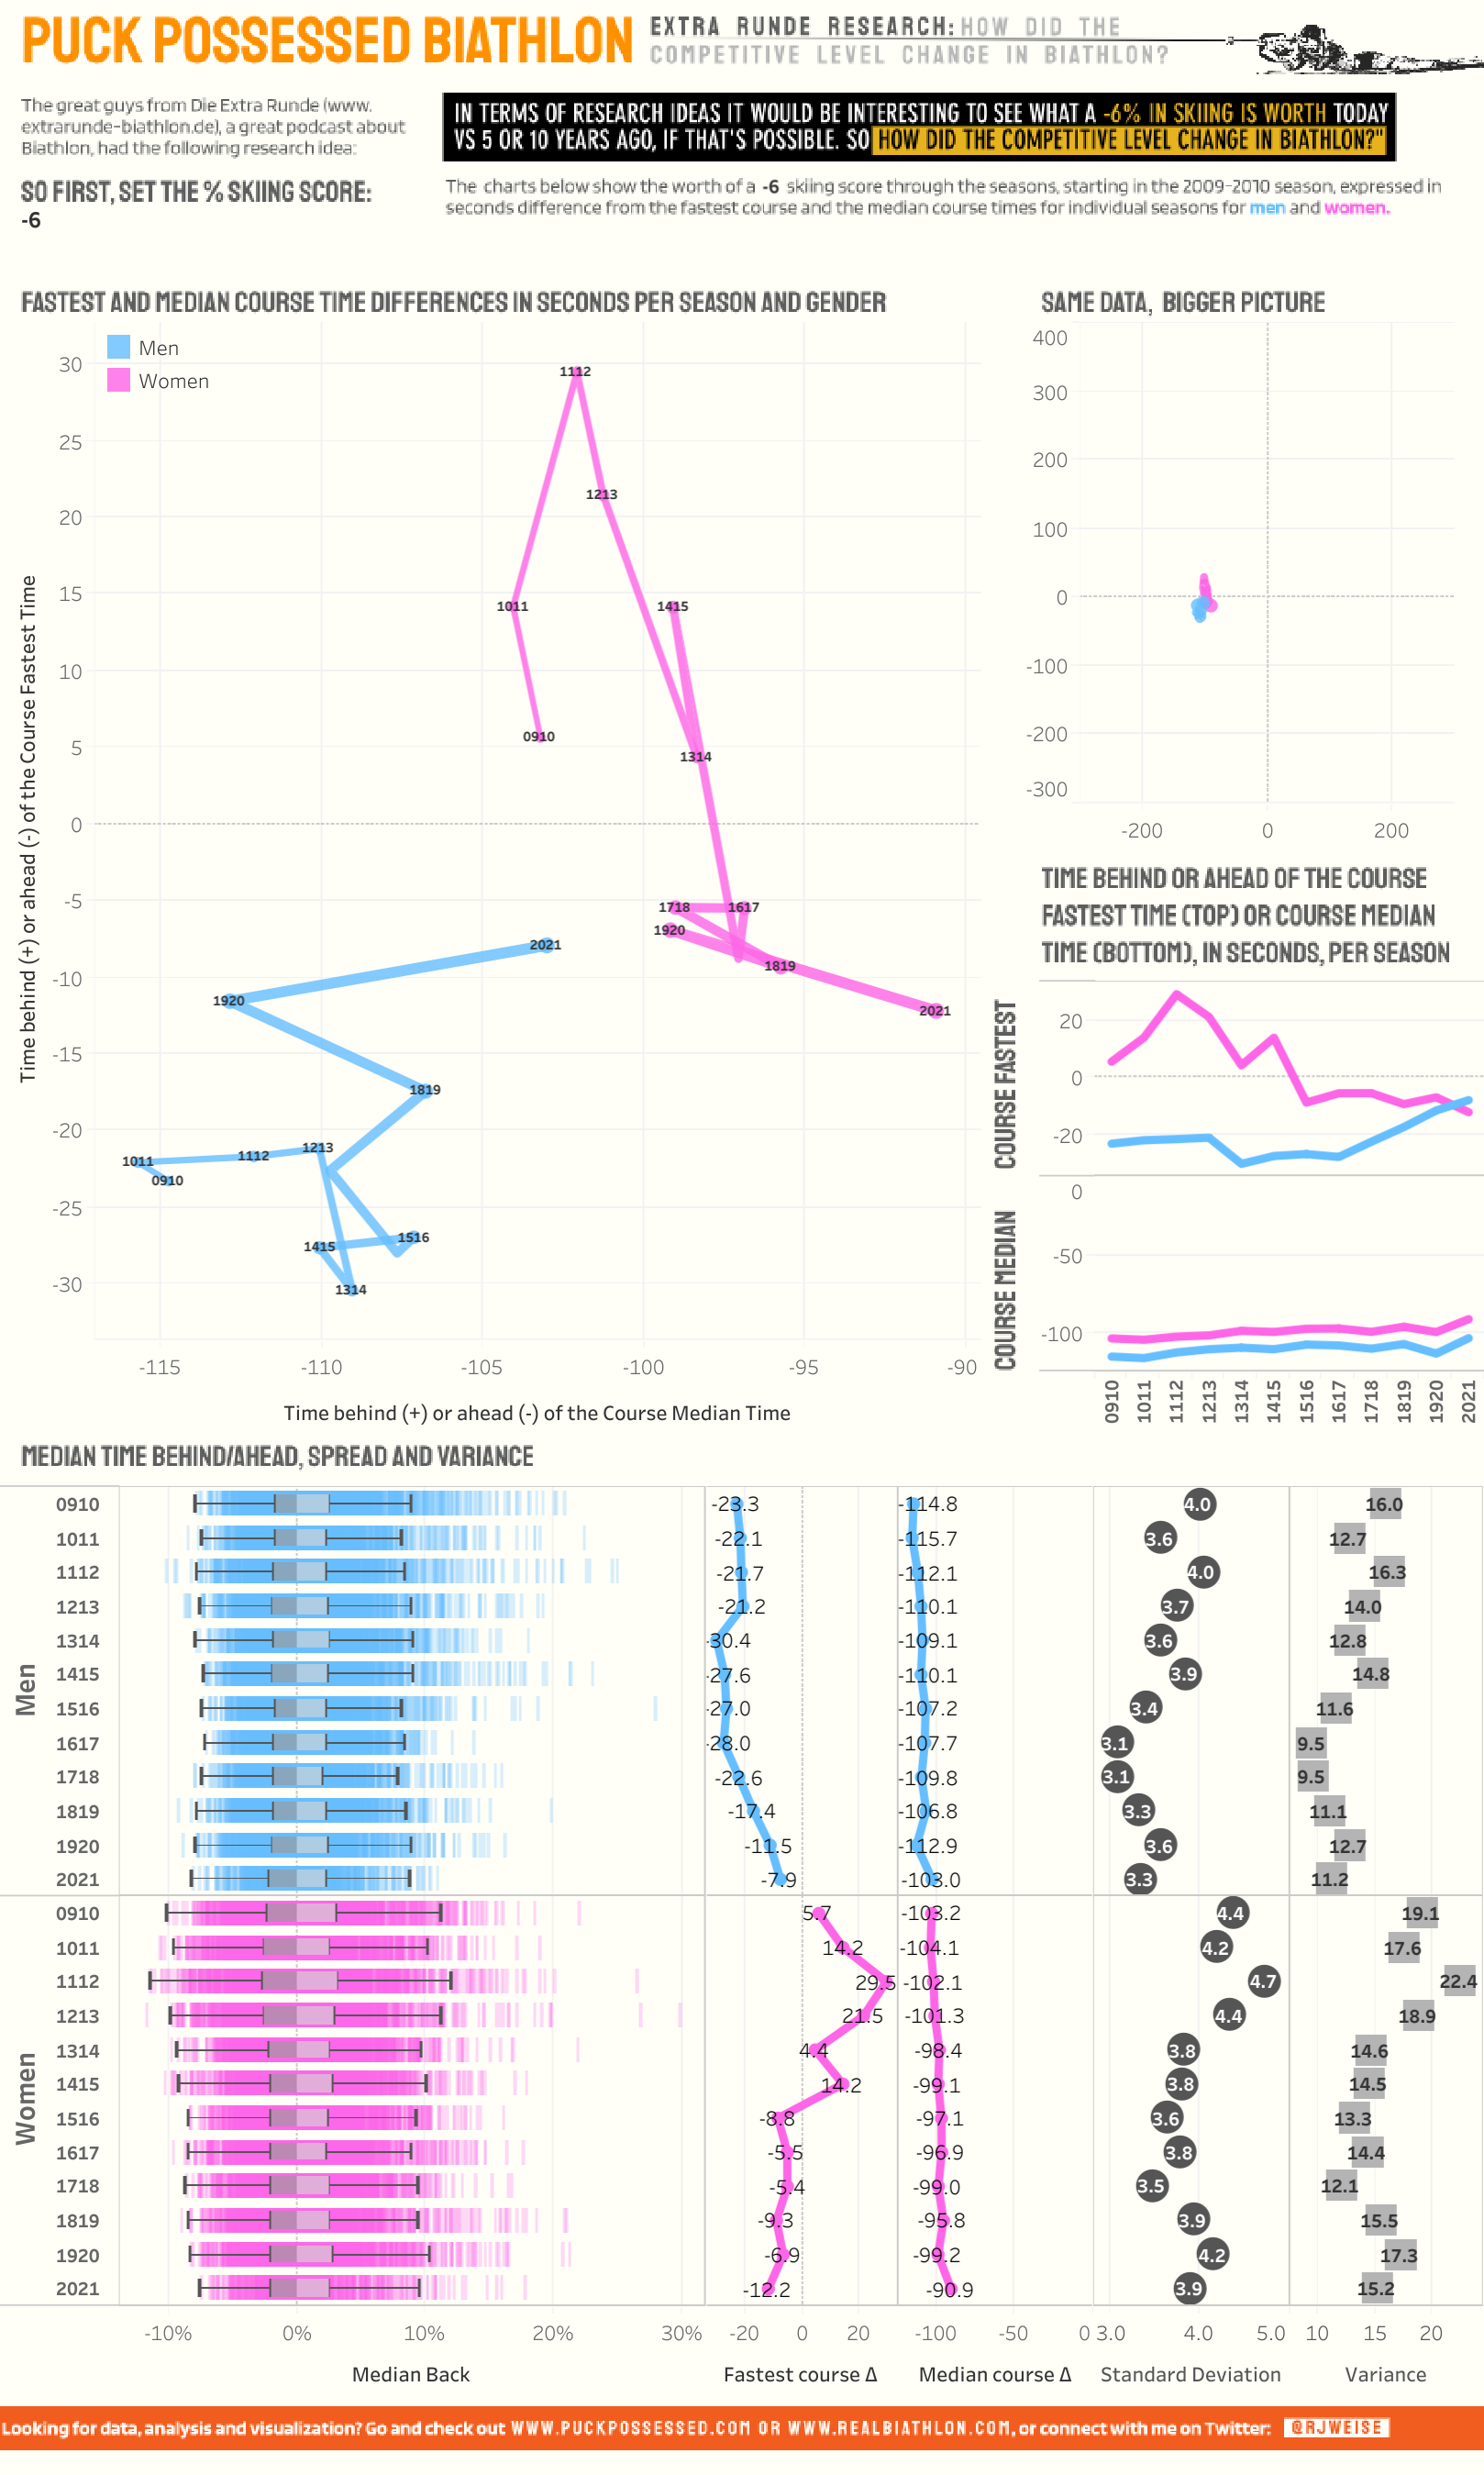
How did the competitive (ski) level change in biathlon?
When something's gotta give: Shooting Speed vs Accuracy
Depending on the event, biathlon athletes fire 10 or 20 shots per race, with the goal to a) hit the target and b) do it as fast as possible. At first thought, you would think the longer you take per shot, the higher your chances of hitting it. But further analysis shows that this train of thought could be wrong.
Using Real Biathlon data to create a dashboard in Tableau
This blogpost shows how to load data from a real biathlon Patreon data subscription into Tableau and make dashboards that help you pick the next winners for biathlon fantasy pools.
Shooting Speed
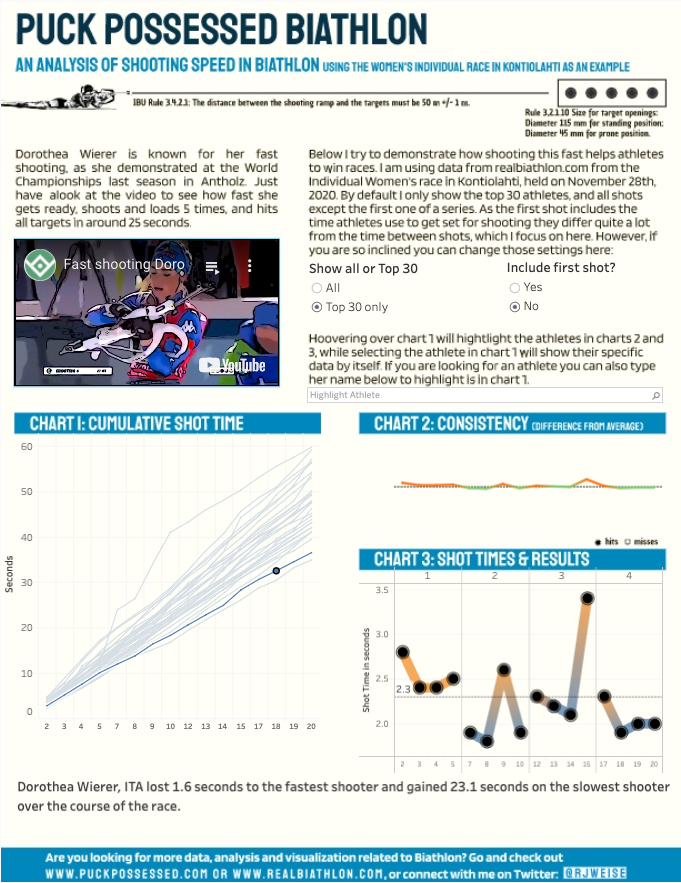
An analysis of shooting speed in biathlon, using the women’s individual race in Kontiolahti as an example.
Improvements season-to-season, putting it to use
A step-by-step on how to make a quick interactive chart based on data from the real biathlon website
Time Behind Score: comparing fruit, rather than apples and oranges
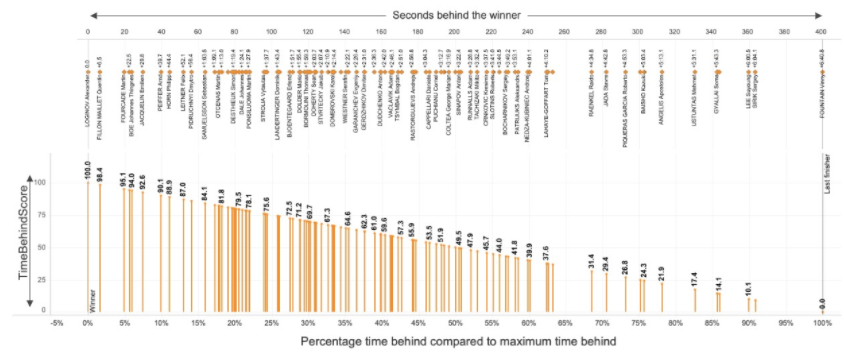
The Time Behind Score is based on the idea that at every level, every athlete is trying to be the fastest and wants to avoid being the last athlete crossing the finish line. It also can be used to compare race results between different seasons and levels.
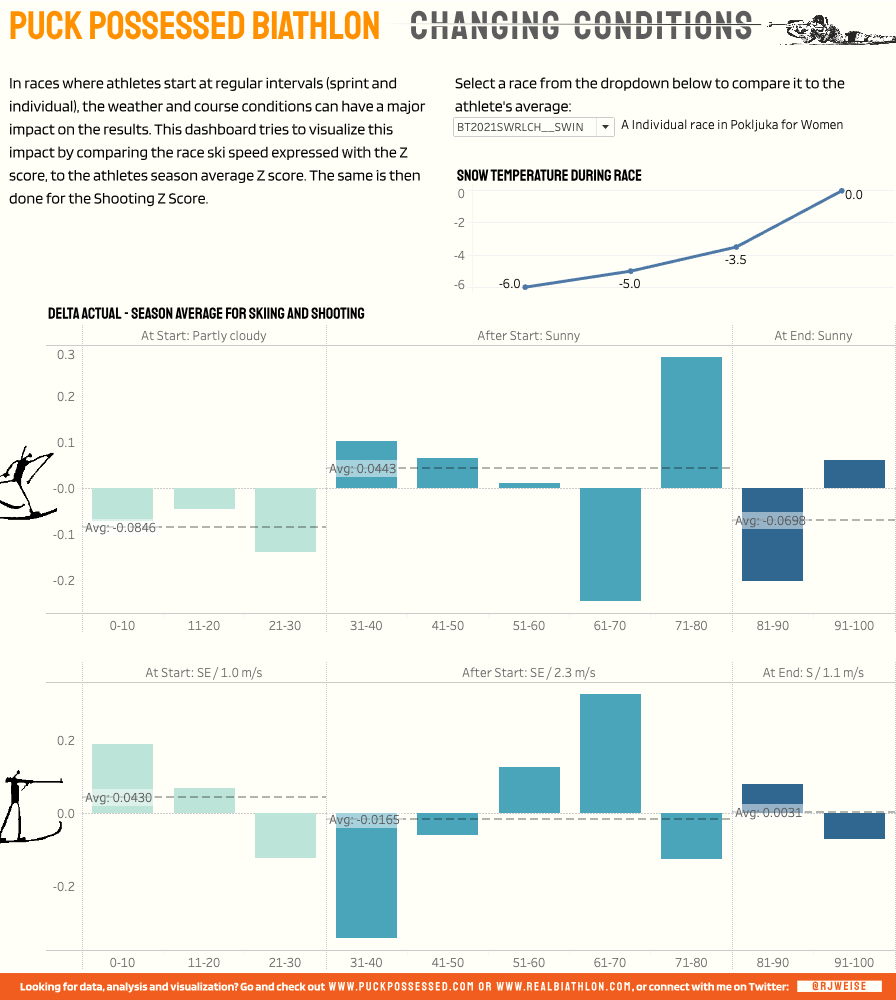
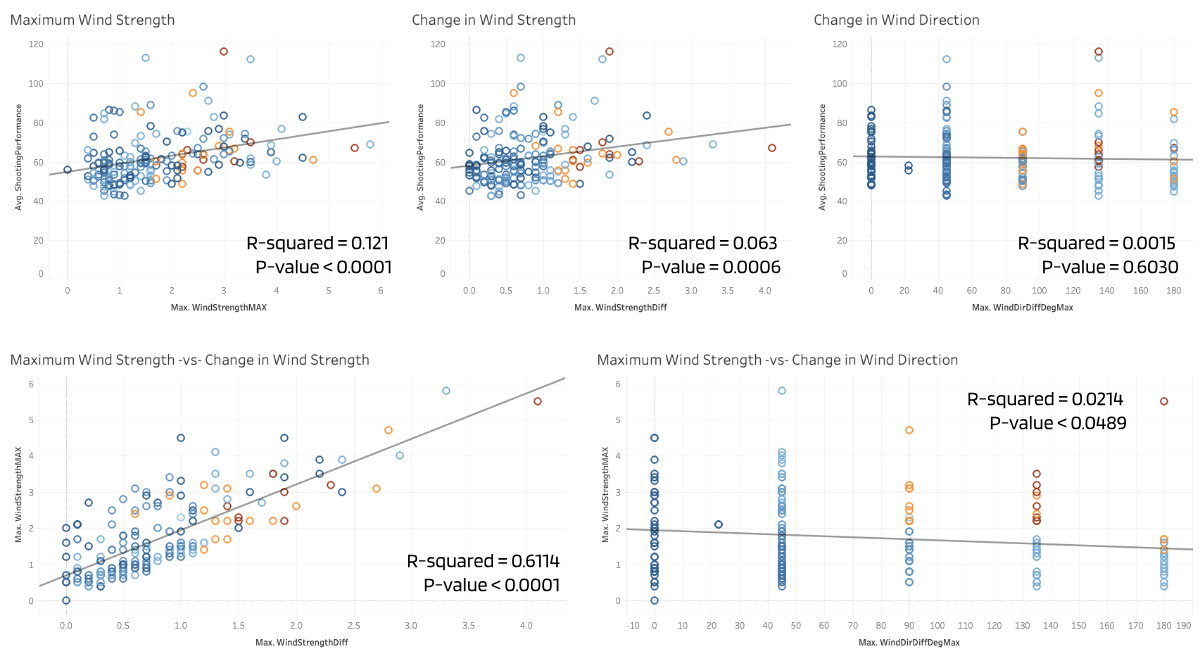
Impact of external factors on shooting performance in biathlon
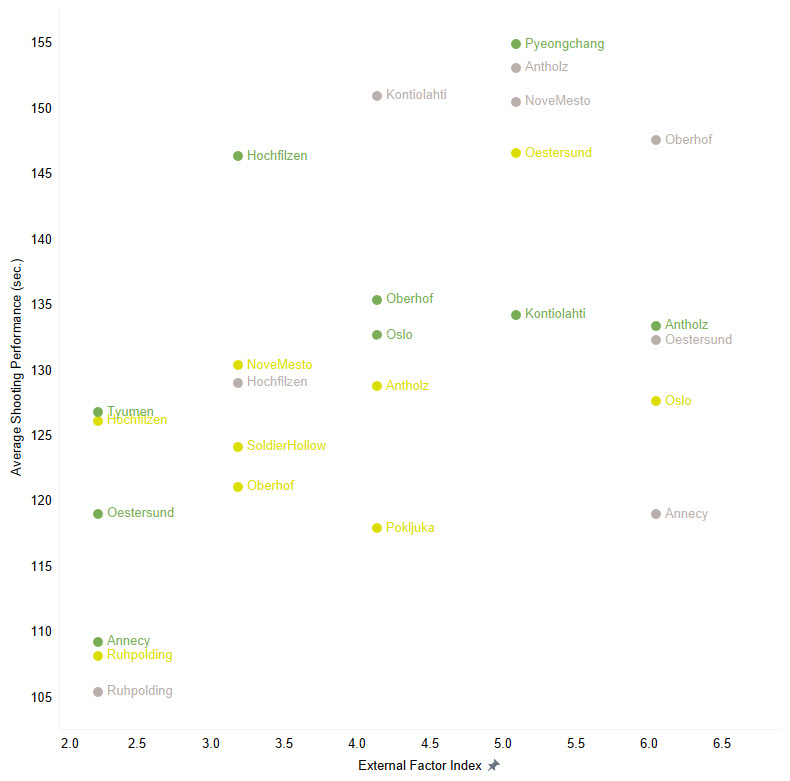
I want to look at the influence of things like weather and snow conditions, as well as course information, on the shooting performance of biathlon athletes.
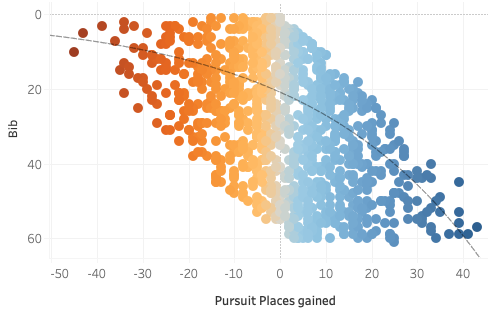
The Queen of Pursuit

Researching which athlete had the best results for Pursuit Races strictly looking at the actual race time, what is the largest difference between the actual rankpoints and total rankpoints, and which athlete made up the most positions?
Puckpossessed Biathlon #7 Canadians
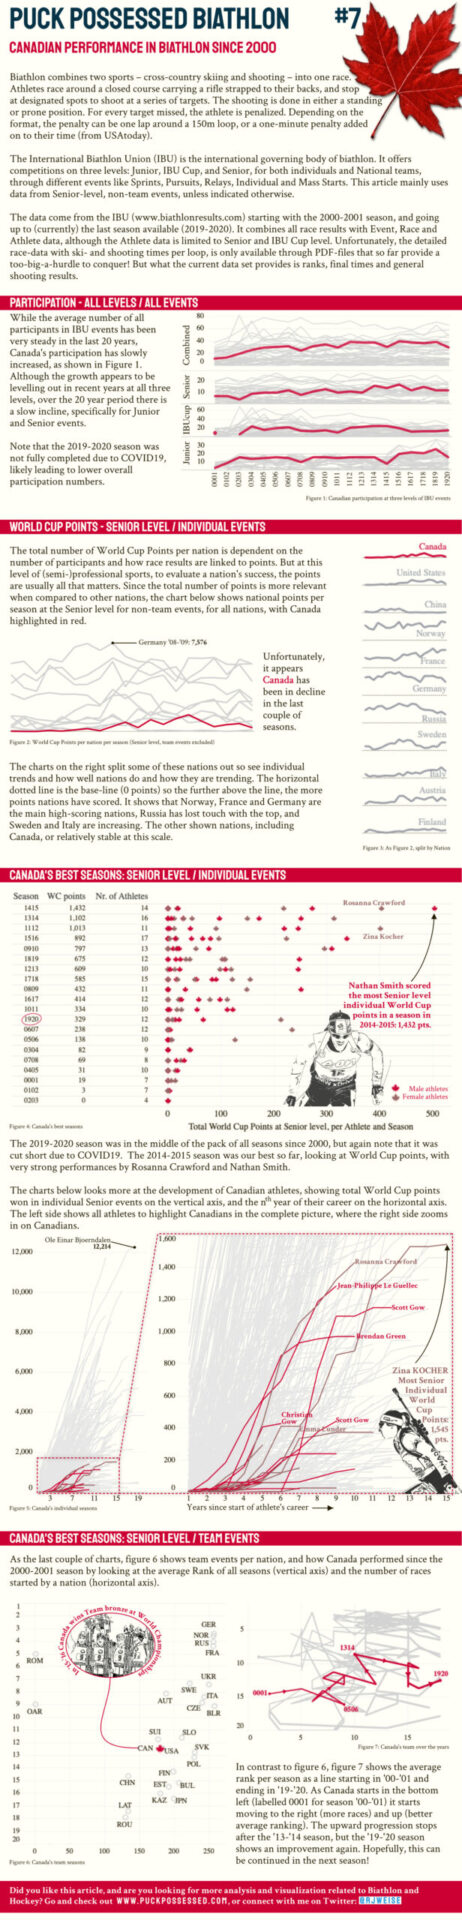
I reviewed the IBU Biathlon data for Canadian performances since the 2000-2001 season and wrote an article. To see the full quality file, download the PDF below. The preview below that is low quality to keep the file a decent size and give an idea what the file looks like. I hope you enjoy. PPB7_CanadiansDownload PuckPossessed #7
Canadian performances in Biathlon since 2000
Looking at Canadian performances in biathlon since the year 2000
PuckPossessed Biathlon #6 The Queen of Pursuit
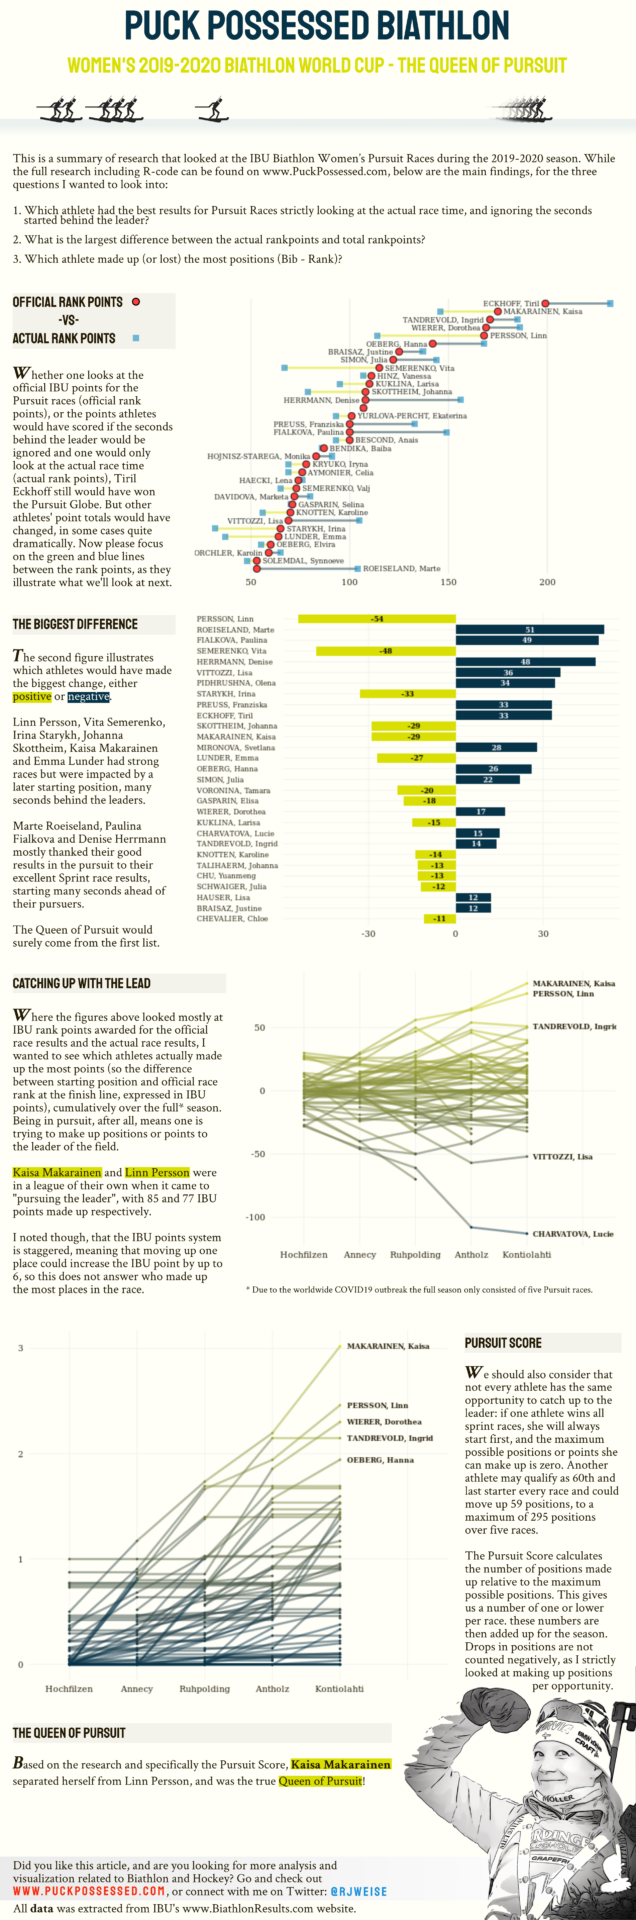
As I’m really liking working in R-Studio, I did my next research in R as well: the Queen of the Pursuit. Unfortunately I am limited to only one season’s data, and a limited season as well. But, as the Dutch saying goes, sometimes you’ve got to row with the oars you got. The full research and R-code can be found on this separate page, and I used another tool I’m quite fond of, Gravit Designer, to create a final result of the research: Here’s the R Notebook including all the code and visuals: BiathlonWomenPursuit_NotebookV2.nb I hope you enjoy. Any comments…
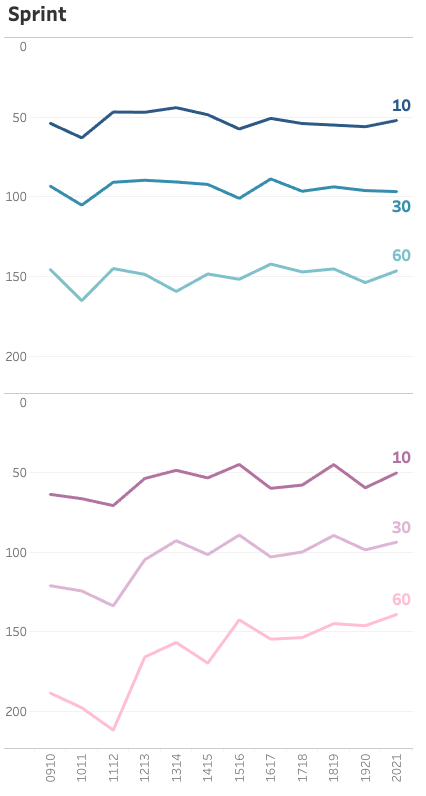
Biathlon Course Time Strategy
Looking at the Course Times per Race and Season, I noticed some strong differences in what laps are faster and slower: Course times for Biathlon Women’s Sprint races For example, Oslo starts fast (the course times are shown in seconds, so the lower the value, the faster the ski) but ends really slow, with a significance time difference. Oberhof on the other hand gets faster as the race goes on. Initially I wondered if these trends were influenced by tactics based on weather conditions, but looking a the chart above it is clear the the trends are strongly dependent on…
Learning R – reading books
After I worked with R in the past and starting playing around with R Studio Cloud recently, I thought it would be a good idea to actually read some books about it. And, as this specific book suggested, make some notes and follow examples in a Markdown Notebook, that can be easily published as an html-file. socvizNotebook.nb And low and behold, I can just save that file and upload it here, so that I just need to click once and see the same document. Very cool! So, one book I read through is Data Visualization, a practical introduction, by Kieran…
Puck Possessed Biathlon #5
For the 5th issue of the Puck Possessed Biathlon series I decided not to use Tableau, but rather give R, R-Studio, Shiny and the ggplot2 package a go. It had been a while that I last used R, but after a few days of struggling, I think I got the basic principles back under control. Well, sort of. First I wrote a script that pulled data from the Biathlon API, for all women that participated in the IBU sprint world cups in the 2019-2020 season. More detailed writing on that process can be found here, while the code is in…
Puck Possessed Biathlon # 4
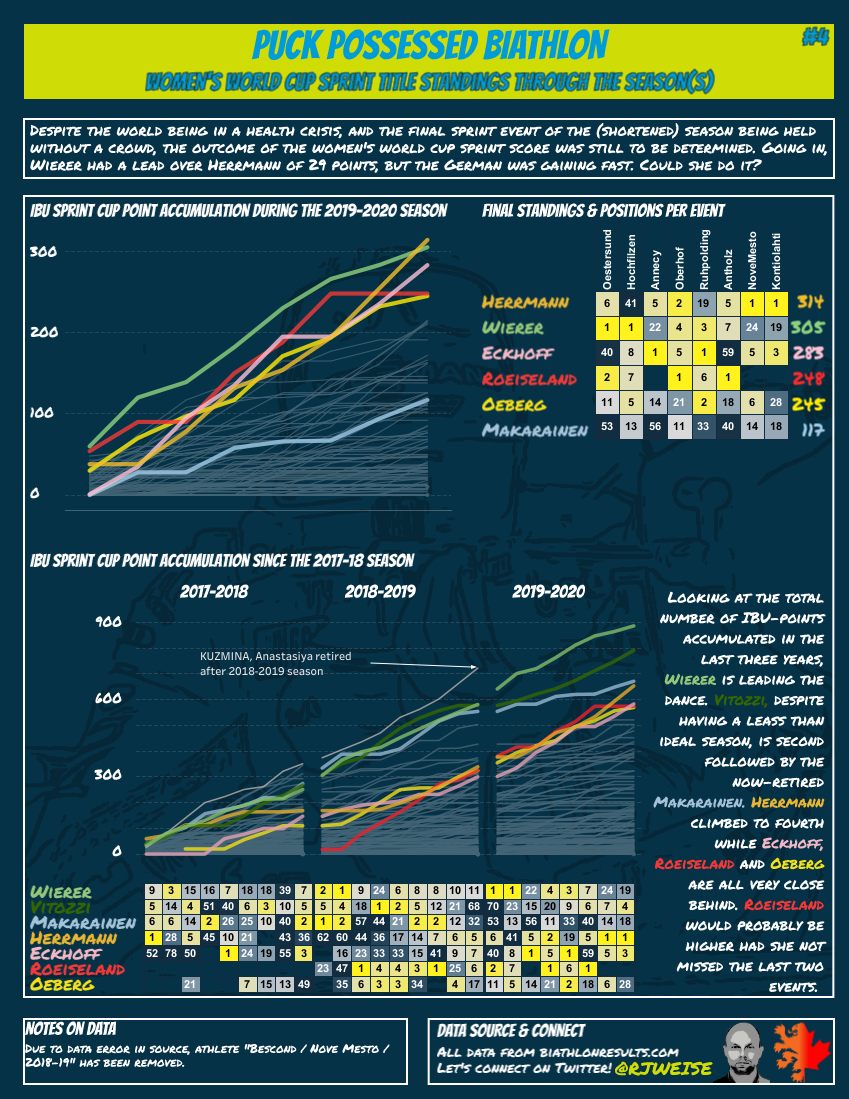
I made a Tableau report on the progress of the Women’s Sprint standing for the 2019-2020 season, with its climax at the last race in Kontiolahti, where Denise Herrmann was able to just get ahead of Doro Wierer for the Sprint Title! I also looked at the last three seasons to see who got the most cumulative points. The report itself can be found on my Tableau Public account, just look for PPB-4 Biathlon Women Sprint – IBU Points (direct link). Screenshot of the report
Puck Possessed Biathlon #3
In the third issue of Puck Possessed Biathlon, I want to look at the influence of things like weather and snow conditions, as well as course information. This is all summarized in reports made available on the https://biathlonresults.com/ website as Final Results – Competition Data Summary: From this report, I used the measurements provided, except for the measurement taken half an hour before the race, as it doesn’t seem that relevant. Also, all these measurements should be taken with a grain of salt (how accurately are they measured, it’s only on one measure location, and some “measurements” are qualitative. In…
Contribution from skiing and shooting performance to the overall sprint race performance
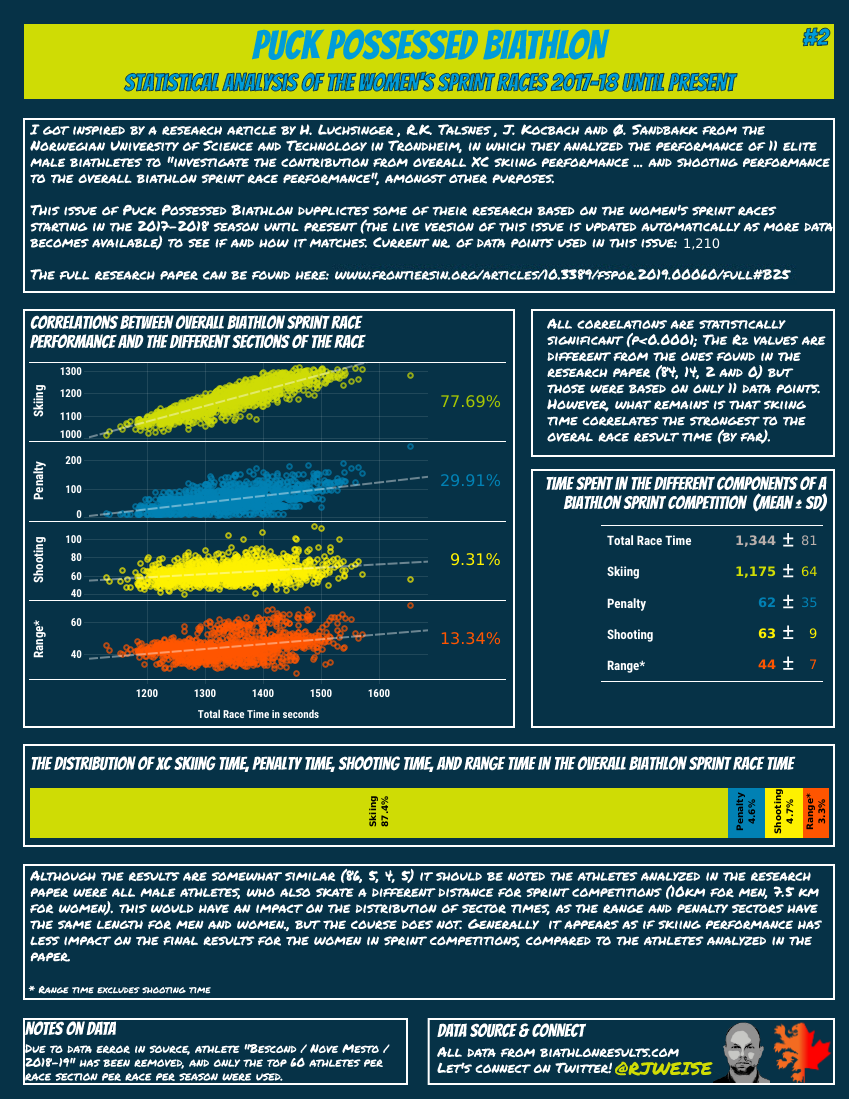
Analyzing the correlations between overall biathlon sprint race performance and the different sections of the race
Puck Possessed Biathlon #1
Alright, finally my first Puck Possessed using Biathlon data. If you are in any way familiar with Biathlon data from the IBU Datacenter you know the pain you have to go through from seeing the data in their great tool to getting it into a data visualization tool like Tableau. So far I have been able to get data for all Women’s Sprint events for seasons 2017-18, 2018-19 and the current season. Although I’m happy that the IBU puts this data out there, it’s unfortunate they don’t do so in a way that would be more user friendly to use…
Posts of the Canadian Fur Trade
A page on Canada’s Open Data Portal got me interested in the Fur Trade in (and around) what we now call Canada. (link) It also contains a map that uses colour, symbology and labels to identify Fur Trade posts based on who was the first owner, when it was started, how long it was active, etc. It’s a great map, and I quote from the site: “Contained within the 4th Edition (1974) of the Atlas of Canada is a map that shows locations of fur trading posts for the period 1600 to 1870.” When I saw this map I really…
Puck Possessed # 9
Puck Possessed Issue 9: shot attempts and scoring chances In issue 2 I talked a bit about shot attempts, but the current issue goes deeper, and also looks at, and explains, scoring chances. The first page of the issue is about shot quality and quality. Is it better to show often or pick and choose only those locations that have a higher statistical chance of scoring? A table compares how teams rank for both shot attempts (abbreviated as SA, not to be confused with shots against) and Goals as a ratio of SAs. These two rankings are then combined, and not…
Puck Possessed #8
National Pride In Canada we tend to call Hockey “our” game. Although possessing something as intangible as the game of hockey, or any sports game for that matter, Puck Possessed issue 8 looks at National Pride in hockey expressed by players in the NHL representing different “nation groups” in the NHL. As looking at all individual nations didn’t make much sense, I combined Sweden and Finland, all former Soviet states, and a rest group combining numerous smaller European countries with one-offs like Australia and Bahamas. I should also note that these are based on the Nationalities listed on the NHL web page; I do…
Puck Possessed #7
Power play success expressed through the time it takes to score a PP goal Power play success is typically shown as a percentage: number of power play goals as a percentage of the number of power play opportunities. Nothing wrong with that. But I was curious to see how long a team typically takes to score during the 120 seconds of power play. Yeah, big caveat; see below in the Data section. And pretty soon I realized it would not be as easy as I initially thought. You’d think I would have figured that out by now…THE DATAI wanted to…
Puck Possessed #6
Issue 6 of Puck Possessed looks at Vorecek’s pass into space rather than dumping it.
Puck Possessed #5
Looking at a wonderful and smart goal by Boeser and Pettersson for the Canucks.
Puck Possessed #4
Edition 4 already, and we are looking at NHL team luck, expressed through shot and goal rates. Take Montreal for example, a team that not many people are expecting much from this season, other than the “Presse de Montreal”. But so far they have doing well, and at the time of writing they have a win percentage of over 60%, closely behind Boston and Toronto (to see current standings based on points and win percentage, check Puck Possessed 3). Where other teams show luck, or lack thereof, with a shot ratio and goal ratio that strongly differ, Montreal have actually…
Puck Possessed #3
Version 3 of Puck Possessed looks at the standings in the NHL, but not just your typical points, but rather winning percentage. I like this much better as it considers the number of games played, so you get a clear idea of what team is actually doing well. The dashboard first starts with the typical standings table and the winning percentage table, but in between them is a chart that shows both, points on the vertical axis and win percentage on the horizontal axis. As this dashboard updates nightly I have to work with a screenshot here but you can…
Puck Possessed #2
This 2nd version of the Puck Possessed is actually a visual I published on Twitter earlier, before I created Puck Possessed #1. What I tried to look at was not just how many shots a player takes and then compare it to the number of goals, but rather look at all a player’s shot attempts, including shot attempts missed, saved and blocked. To this day I do not know how a “broken stick shot” is recorded, but if considered a missed shot that would be included too. Personally I find it more interesting to see how many goals a players…