
Introduction
This article accompanies the Tableau Public dashboards I created to highlight those athletes who performed better than their season average at the Olympic Winter Games in Beijing, and look at those below their average.
Data
The data used for this analysis are all from the race analysis reports from the non-team IBU races in the 2021-2022 season up to and including the Olympic Winter Games in Beijing. The data was then split into two groups. The Olympic Games races, and the races during the first two trimesters of the season. After averaging the performances per group, the two groups were then compared.
I would like to note that the data for the Olympic games is based on four races or less. This is a very small sample size to use for averages that show Olympic performances. While some of these performance differences can be explained by (bad) luck on an individual level, at the nation or gender level the averages will eliminate or at least significantly reduce this luck factor.
Performances
This analysis looks at which athletes over- or underperformed compared to their statistics in the first two trimesters of the IBU World Cup, rather than at their overall performance at the Olympics. For example, while Justine Braisaz-Bouchet went home with a gold medal, on average she was slower and shot a lower percentage than her first two trimesters.
The Skiing performance is expressed in the average seconds behind the leader per 1,000m. The calculation uses the total course length as provided on the IBU Biathlonresults.com webpage. Please note that by using this metric we also get a sense of how much the field was spread out, as it looks at the seconds behind the leader.
The Shooting performance uses the average total shooting percentage (prone and standing combined).
As the values for both skiing and shooting performances differences were in the same range I added a Combined difference of the two. A negative skiing performance and positive shooting performance are considered improvements. Therefore the calculation is [Shooting performance] – [Skiing performance].
Field
Before jumping into the individual results it is a good idea to look at the averages for men (blue circle), women (orange triangle) and everyone combined:
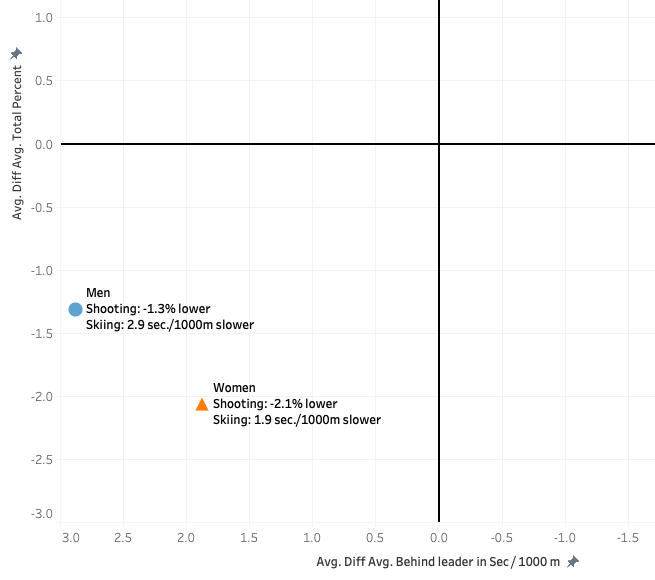
From these numbers, we can assume that both the skiing conditions as well as the shooting conditions were tougher than the average conditions during the first two trimesters as all athletes combined were (on average) 2.4 sec./1,000m slower and shot 1.7% worse. This aligns with what we have seen and read about the Olympic races being very tough.
Tableau dashboards
I encourage you to have a look at the table and charts on Tableau Public page I created for this analysis. It allows you to filter the data and will show you additional information by hovering over the data points. It will also allow you to see more details and information than described below. The screenshots used in this article are taken from the same dashboards.
Men
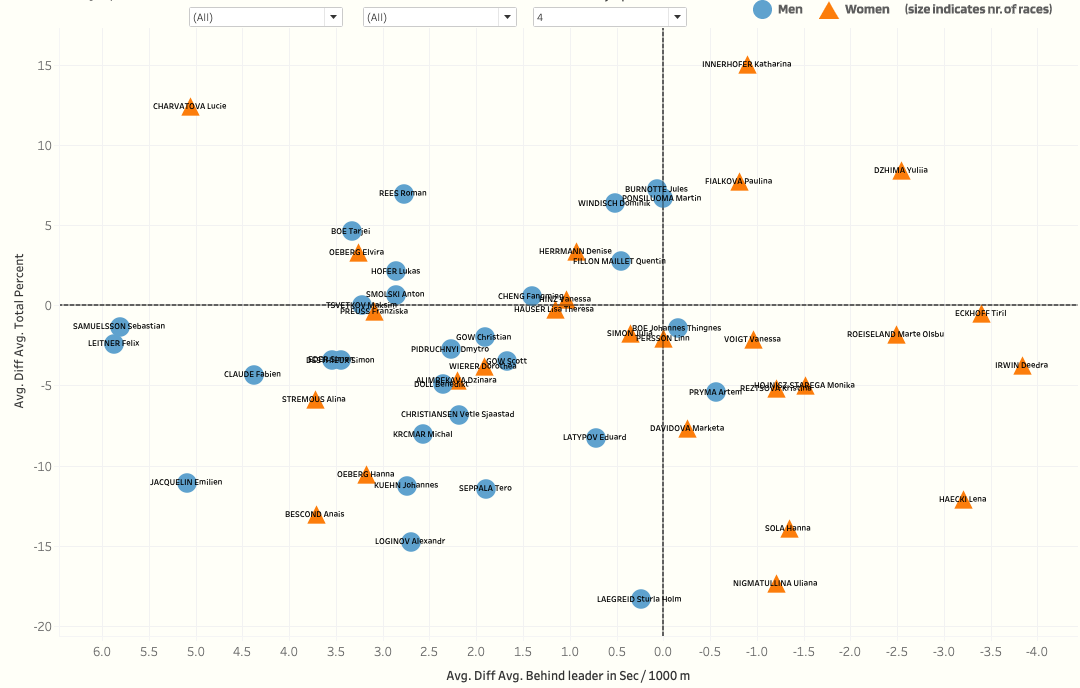
When looking at the men’s performances for all athletes that raced all four non-team events (you can change this in the interactive dashboards), the Canadian Jules Burnotte had the best performance improvement during the Olympics. He had basically the same ski speed and shot 7.25% higher than in the first two trimesters. Martin Ponsiluoma, Dominik Windisch, Roman Rees, Quentin Fillon Maillet and Tarjei Boe were also better (on average) compared to their first two trimesters.
Sturla Holm Laegreid on the other hand had the worst performance, seeing his shooting percentage drop by over 18% and skiing just a tiny bit slower. Emilien Jacquelin and Alexandr Loginov probably also had hoped for better individual performances.
There were only two male athletes with four races that improved their skiing performance: Artem Pryma from Ukraine, and Johannes Thingnes Boe from Norway. And they only shaved off 0.6 and 0.2 seconds per 1,000m respectively (but keep in mind the average for men was 2.9 seconds/1,000m slower). Emilien Jacquelin, Sebastian Samuelsson and Felix Leitner lost the most speed, with more than five seconds/1,000m.
When looking at all athletes, regardless of how many races they participated in, Raido Raenkel from Estonia (3 races) was 1.14 sec./1,000m slower but shot 17.5% better, for a combined improvement of 16.36, the best of the field. He was closely followed by Matej Baloga and Sebastian Stalder.
Women
On the women’s side, the best performance improvement came from Katharina Innerhofer from Austria (only including athletes with all four races). She was almost a second faster and shot 15% better. Yuliia Dzhima, Paulina Fialkova, Lucie Charvatova, Tiril Eckhoff, Denise Herrmann, Marte Olsbu Roeiseland, Deedra Irwin and Elvira Oeberg were the other female athletes who improved compared to the first two trimesters.
Hanna Oeberg, Uliana Nigmatullina and Anias Bescond had the largest combined decrease in performance.
There were actually 13 athletes who improved their skiing performances during the Olympics, with not the much-discussed athlete Tiril Eckhoff making the biggest improvement, but Deedra Irwin (3.8 sec./1,000m) from the USA. Lucie Charvatova on the other hand lost just over 5 sec./1,000m.
The same Charvatova, and Kathariana Innerhofer improved their shooting the most, by 12.4 and 15% respectively, while Anias Bescond, Hanna Sola and Uliana Nigmatullina had the biggest drop in shooting percentage (13, 14 and 17.3%).
For all athletes, ignoring the number of races they participated in, the best improvement was by Maria Zdravkova from Bulgaria (2 races), who was 0.45 sec./1,000m faster and shot 17.5% above her pre-Olympic season average. Innerhofer (4 races) and Erika Janka from Finland (1 race) were close behind.
The athletes in the top right corner improved both in skiing and shooting. The bottom left corner has a decrease in both:
Nations
The performance improvement results for nations, split by gender, are based on all athletes that participated for a nation in non-team events, regardless of the number of races they participated in. This should be kept in mind when looking at nations like Denmark&Greenland women and New Zealand men (2 races total for both), or Sweden (women) and Germany (men) with 16 races. For the following paragraphs, I only looked at nations that had 8 or more races in total (half of the max. number of races possible).
Since we are only looking at the nation’s average, the results don’t say anything about how spread out the individual results were within the team, and this can strongly vary between teams. The averages were calculated by averaging all the nation’s athlete’s race results, rather than averaging the athlete’s averages per nation and gender.
Women
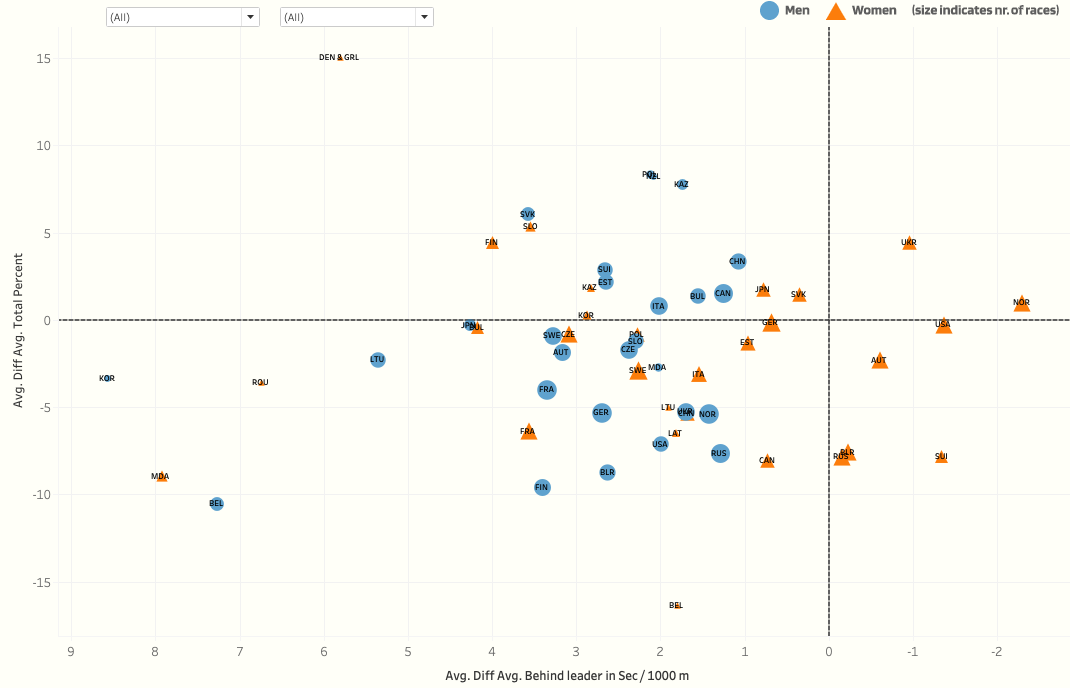
The top 6 nations on the women‘s side all had an improvement: Ukraine, Norway, Slovakia, USA, Japan and Finland. All other nations had a decrease in combined performance, with France having the worst combined performance improvement followed by Canada, Russia, Belarus and China. Norway improved most in skiing, and Ukraine in shooting.
Men
Moving over to the men‘s side, there were only four nations that improved on their combined performance: Slovakia, China, Canada and Switzerland. The worst combined performances were from Belgium, Finland, Belarus, USA and Russia. The biggest improvers in skiing were China, Canada, Russia and Norway, while Slovakia, China Switzerland, Estonia, Canada, Bulgaria and Italy were the only nations that improved their shooting performance.
When we look at a combined overview we can see that overall women made bigger improvements than men:
Again, I encourage you to check out these visuals interactively on Tableau Public, specifically the ones used above: Athletes Table, Athletes Chart and Nations Chart.
Cheers!