
Introduction
In my last article, “Is one shot like any other in biathlon?“, I looked at the hit rates for every shot in biathlon for non-team races. The following looks at hit rates again, but this time for Relays. Relays are different in the sense that every shooting has three extra rounds that can be manually reloaded, so determining which shots were hits and which were misses works a little differently.
I also looked at the data to see if I could link the hit rates to pressure. But again the three reloads and also the fact that we are dealing with multiple athletes per relay team, puts a whole new perspective on that.
Data
Unfortunately, I found that the data I used for non-team races to determine per shot if it was a hit or miss, was not usable for determining the same for relay races. What I need for relays is only available since the 2020-2021 season. To be more specific, what I need is tracking of which target is hit by which shot.
For example, since the 2020-2021 season, a shooting result can look like 57621. This means the alpha target was hit with the fifth shot, the bravo target with the 7th shot, charlie with the sixth shot, delta with the second shot and echo with the first shot (biathlon targets are usually listed from left to right, abcde). We can also conclude that the athlete shot right to left with a shooting order of hit, hit, miss, miss, hit, hit, hit and that the athlete used two reloads.
Before the 2020-2021 season, this would have been tracked as 54321, meaning that every target (eventually) went down. But it would not be possible to determine which shot actually knocked the targets down and how many bullets (and reloads) were used. This wasn’t a problem for non-team races as there are no reloads, and thus always five shots only.
What this all comes down to is that I can only use data since the 2020-2021 season, which means we only have data for 24 races including the most recent ones in Oberhof 2022. So a total of 27,702 shots for all teams that finished a race.
Some quick and cool facts
Some initial findings after looking at the data are that the most common shooting is 54321. So shooting right to left and hitting all targets without reloads (15.3%). This is followed by 12345, shooting left to right hitting all targets without reloads (8.8%). On the opposite hand, one of the old school shooting orders that starts with target charlie, the centre target, 32154 only happened 5 times (0.02%) and all by Yurie Tanaka, a 33-year-old soldier from Japan.
To include or not include, that’s the question
As I write this I just saw the single mixed relay in Oberhof, and after watching that race I was debating if I should include the data from the single missed relay races or not. It follows the same pattern as all other team races, but because of the short loops and the fact that only two athletes participate, the shooting seems very chaotic and not very representative of the athletes’ abilities. That would remove another 4 races.
On the other hand, perhaps the Oberhof race was just an exception due to the conditions. And when averaging values out of 24 races, one race that may have been a little out of the ordinary will not have a major impact. So for now, I’ll be including the single mixed relays as well.
Matrix
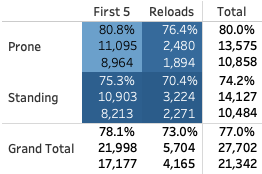
So let’s look at all the shots (left to right) and shootings (top to bottom) and determine the hit rates for every combination. The bottom left square is shooting 8, shot 1 and the top right is shooting 1 and shot 8. The final three shots of every shooting are the manual reloads, and since not every athlete needs them, there are fewer of those. The total numbers are the averages for the respective rows and columns. Finally, the labels indicate the hit rate, also represented by the colour, total number of shots and number of hits in brackets.
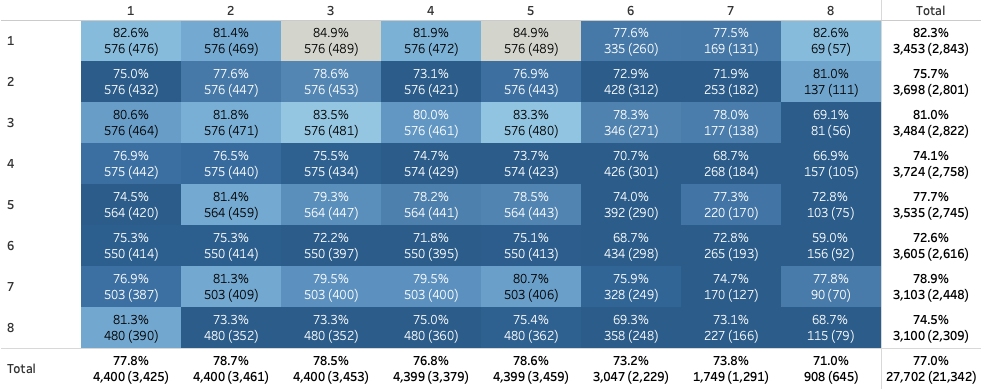
One thing to remember is that all odd-numbered shootings are prone, and all even-numbered shootings are standing, and shots six, seven and eight are manual reloads.
How do “regular” shots compare to reload shots?
One thing we can conclude from the matrix above is that the hit rates for the first five shots are better than the three reloads. One can argue this is not a fair comparison as there are fewer reload shots, but I think there are enough shots to see that they differ. Let’s look at the five regular shots first.
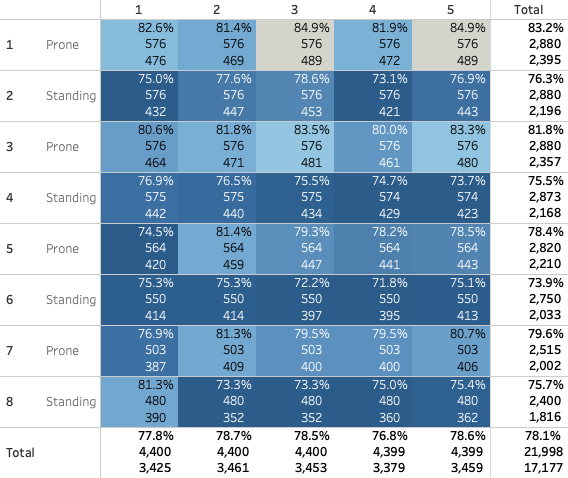
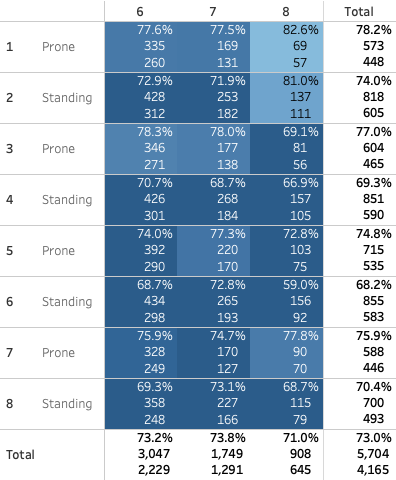
The only thing that stands out to me here is that the 7th and 8th shootings are not the worst for prone and standing shooting respectively. With regards to having more pressure on the last shooting, this doesn’t prove (or deny) anything. But as mentioned before, the additional reloads put a different perspective on pressure. So let’s look at the last three shots for the eight shootings below.
Here we also see that the last prone and standing shootings are not the worst of the whole series. One highly important thing to remember is that the shooters are not the same for all shootings. Can we perhaps say something about tactics based on the four groups of two shootings with regards to the quality of shooters?
Let’s summarize this a little
If we aggregate the shots per shooting ( so basically look at the totals per row of the two charts above) we could conclude that the first athlete is the best shooter. Followed by the second shooter, then the fourth shooter and the third shooter being the worst of them. Note that this also includes the single mixed relay as mentioned earlier, which only includes two athletes that each have double shooting responsibilities compared to full team races.
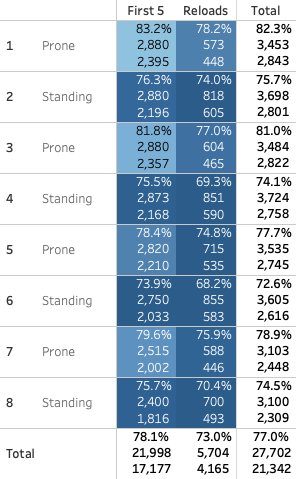
If we take out the individual athletes we can summarize this even further by summarizing the shootings, or columns. Fair to say is that Prone shooting has a higher hit rate than Standing (duh), and Reloads have a lower hit rate than the First 5. This is not surprising as the manual reload of every bullet breaks the rhythm and shooting position every time. I also think (but cannot prove based on the data) that there is some added pressure with Reloads, as you really want to avoid the penalty loop when you have three spares at this level.
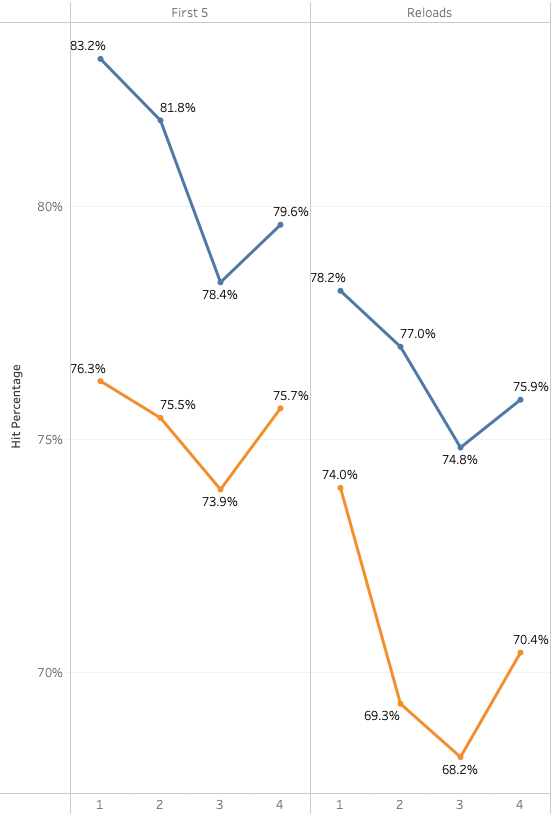
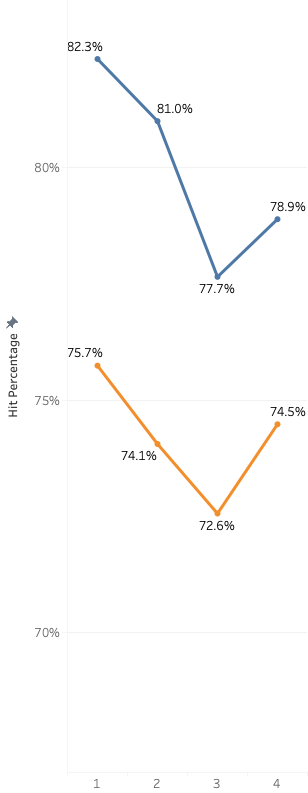
These line charts show the same data as the left matrix above, with the first chart showing the “first 5” and Reload shots, and the second chart the Total column. In these charts, orange represents Standing shooting, and blue the Prone shooting. We can more clearly see that the third shooter is typically the worst of the four.
What if we do this for the top 5 (or 10, 15)?
As if we haven’t talked about enough variables yet that impact our possible conclusions, so far we have only looked at data from all the athletes and races. Would this look different if we only looked at the top 5, top 10 or top 15?
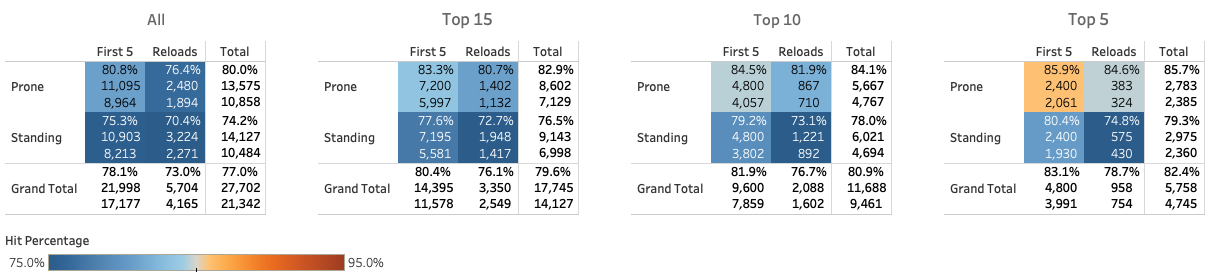
Other than the hit rates going up from left to right as we limit ourselves to better athletes, the patterns remain the same. So from that perspective, my confidence is pretty high in saying that…
Conclusion
… also in the relay, a shot is not a shot like any other, especially between shooting from a cartridge/magazine and after loading by hand. But there are just too many factors to say something useful otherwise. And specifically anything about pressure or relay tactics, with only some hints about which shootings have the better athletes, and some of the lower reload hit rates potentially being caused by more pressure.
Do you think I could have come to any other conclusions based on the data and charts above? Please let me know on Twitter or Instagram!