
By Najtrebor
This article mainly uses data from Senior-level, non-team IBU Biathlon events since 2000, unless indicated otherwise. The data come from the IBU (www.biathlonresults.com) starting with the 2000-2001 season, and going up to (and including) the 2019-2020 season). It combines all race results with Event, Race and Athlete data, although the Athlete data is limited to Senior and IBU Cup level. Unfortunately, the detailed race-data with ski- and shooting times per loop, is only available through PDF-files that so far provide a too-big-a-hurdle to conquer! (Clearly, I wrote this article before this amazing website was re-instated!) But what the current data set provides is ranks, final times and general shooting results.
Participation – all levels and events
While the average number of all participants in IBU events has been very steady in the last 20 years, Canada’s participation has slowly increased, as shown in Figure 1. Although the growth appears to be levelling out in recent years at all three levels, over the 20 year period there is a slow incline, specifically for Junior and Senior events.
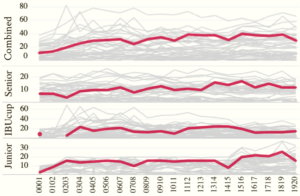
Note that the 2019-2020 season was not fully completed due to COVID19, likely leading to lower overall participation numbers.
World Cup Points
The total number of World Cup Points per nation is dependent on the number of participants and how race results are linked to points. But at this level of (semi-)professional sports, to evaluate a nation’s success, the points are usually all that matters. Since the total number of points is more relevant when compared to other nations, the chart below shows national points per season at the Senior level for non-team events, for all nations, with Canada highlighted in red.
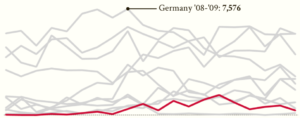
Unfortunately, it appears Canada has been in decline in the last couple of seasons.
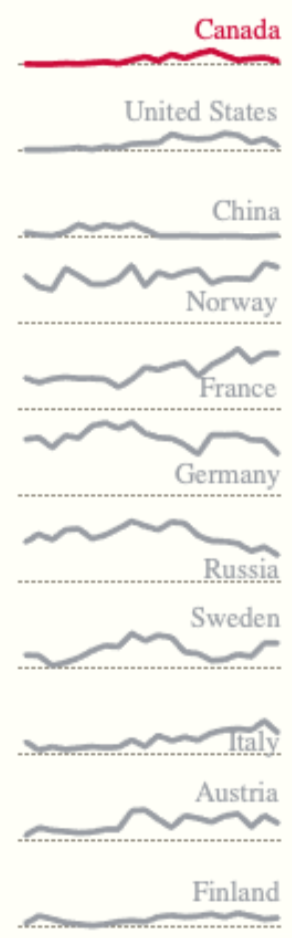
The chart on the right split some of these nations out so see individual trends and how well nations do and how they are trending. The horizontal dotted line is the base-line (0 points) so the further above the line, the more points nations have scored. It shows that Norway, France and Germany are the main high-scoring nations, Russia has lost touch with the top, and Sweden and Italy are increasing. The other shown nations, including Canada, or relatively stable at this scale.
Canada’s best
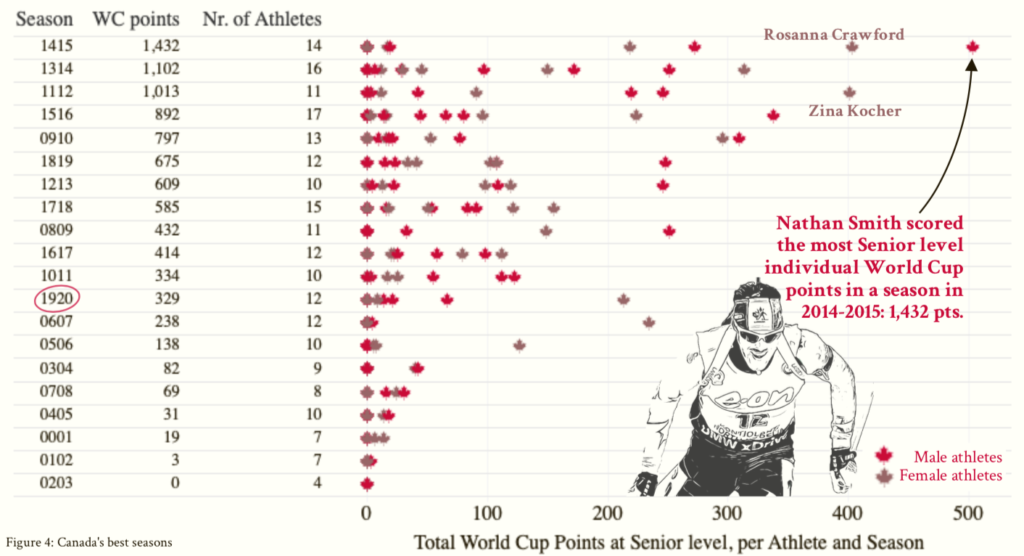
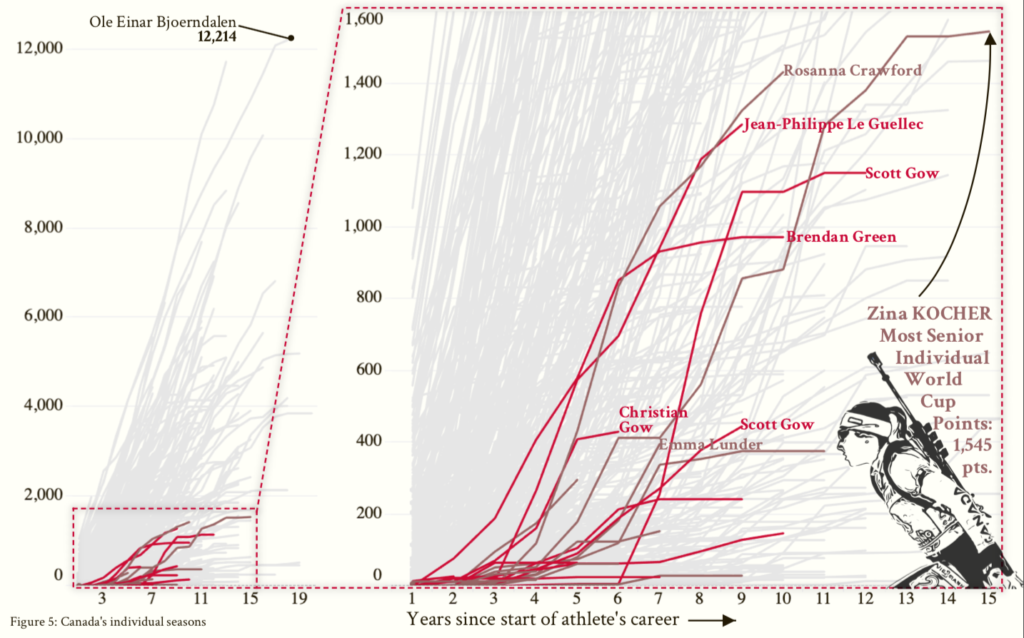
The 2019-2020 season was in the middle of the pack of all seasons since 2000, but again note that it was cut short due to COVID19. The 2014-2015 season was our best so far, looking at World Cup points, with very strong performances by Rosanna Crawford and Nathan Smith.
The charts below looks more at the development of Canadian athletes, showing total World Cup points won in individual Senior events on the vertical axis, and the n year of their career on the horizontal axis. The left side shows all athletes to highlight Canadians in the complete picture, where the right side zooms in on Canadians.
Canada’s best seasons: team events
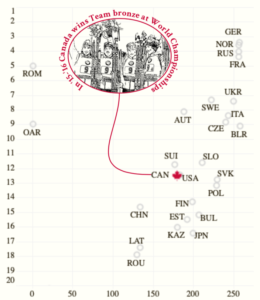
As the last couple of charts, figure 6 shows team events per nation, and how Canada performed since the 2000-2001 season by looking at the average Rank of all seasons (vertical axis) and the number of races started by a nation (horizontal axis).
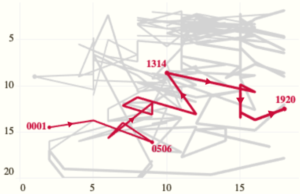
In contrast to the figure above, the figure below shows the average rank per season as a line starting in ’00-’01 and ending in ’19-’20. As Canada starts in the bottom left (labelled 0001 for season ’00-’01) it starts moving to the right (more races) and up (better average ranking). The upward progression stops after the ’13-’14 season, but the ’19-’20 season shows an improvement again. Hopefully, this can be continued in the next season!
The full pdf of the article above can be downloaded below.