
Introduction
After listening to an episode of Doppelzimmer, a german podcast in which Erik Lesser and Arnd Peiffer talk about biathlon, I got curious. Curious about analyzing if the field has gotten narrower between biathlon nations in the last two decades. Erik and Arnd were talking about this and saying that people always mention the field is getting narrower, but that it would be interesting to do some analysis about it to see if this is actually true. This is my analysis on that topic.
Data
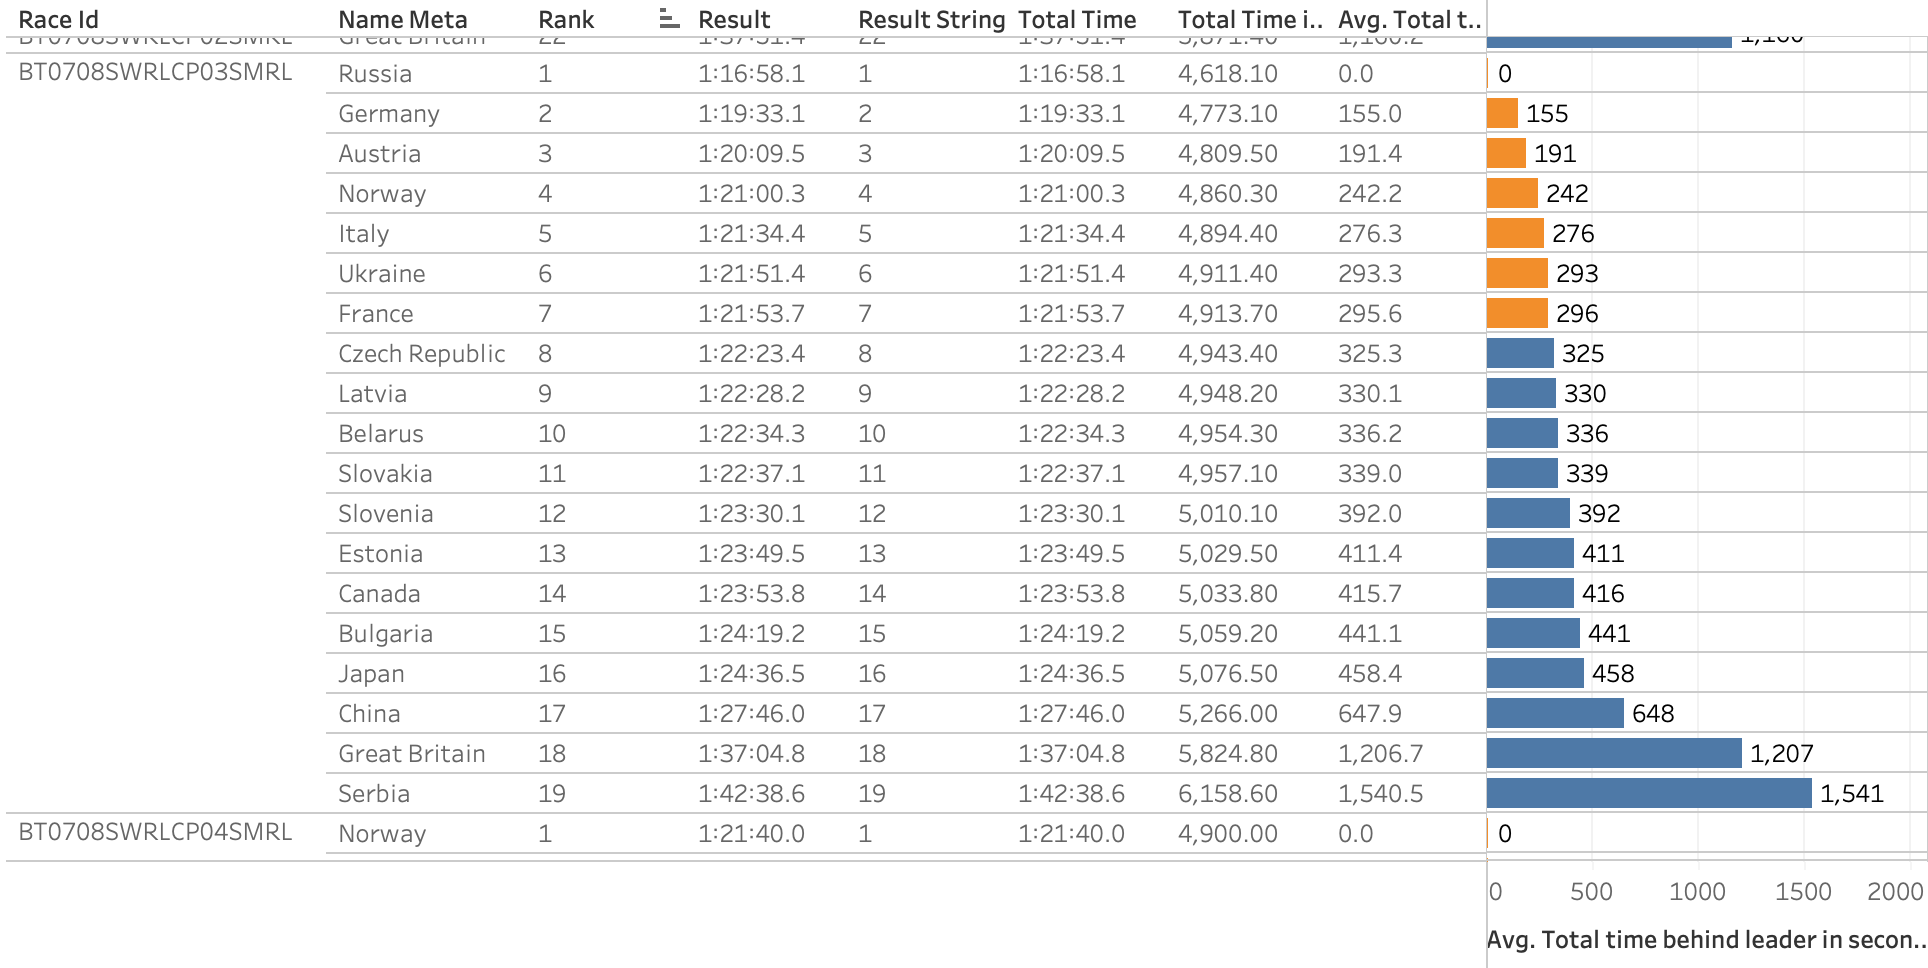
For this research I used all Men’s Relay races on the IBU World cup, World championships and Olympic Games since the 2000-2001 season, ending at the 5th event of the current 2021-2022 season. I removed all nations that did not start, did not finish, got lapped, etc. Then I did some conversions of times from hours, minutes and seconds into seconds and did data validation as some years had some bad data quality in some fields.
Measures
Then the question was how to measure the narrowing of the field in biathlon. I took a two-sided approach on this: for one I looked at how many seconds the 15th ranked team was behind the eventual winners of the race. This should give me a good idea of how much the weaker teams are behind the top team, expressed in time. The other approach was to see how many teams finished within 5 minutes of the winning team. This gave me another look at how many teams could be considered stronger teams.
The 15th rank and the 5 minutes are variables that can be debated forever. But the reasoning for the 15th team is that in many cases there weren’t that many more teams in the race that finished. The 5 minutes is an arbitrary number I decided on after spending some time going through the data and looking at the distance in time between the better teams of the time.
Analysis
As one would expect, due to different venues, weather conditions, team lineups and other factors, the results are kind of up and down from one race to the next.
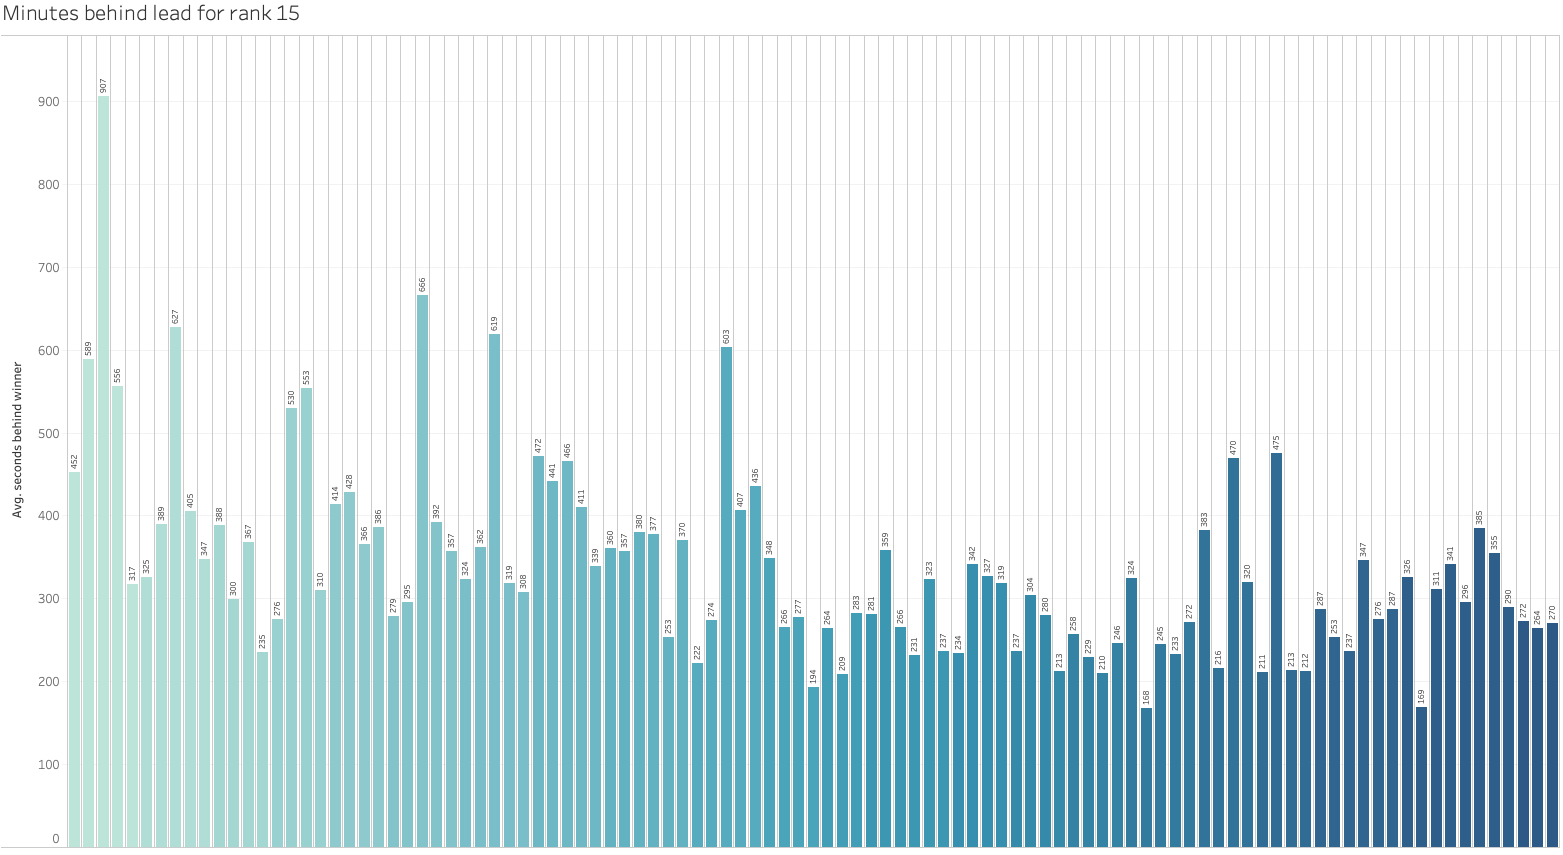
Although we can kind of see some vague hints of a trend in the second chart, it really doesn’t show it at a level that would make me comfortable to claim a trend exists.
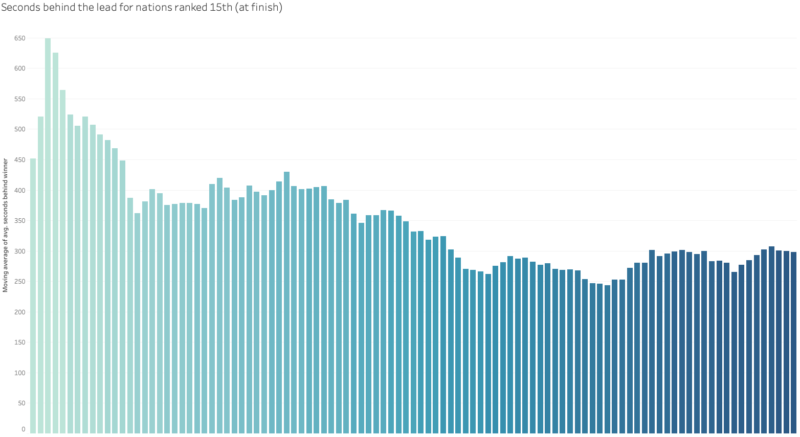
Luckily we can use the moving average function. For every race, this takes the race’s result plus the previous 10 races (about two seasons worth) and averages them. This gives a clearer picture and a better idea of the trends over the last two decades.
Results
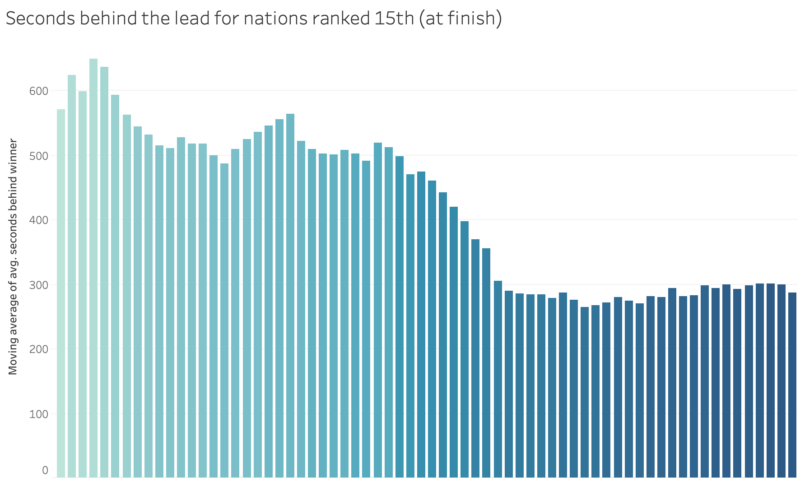
The first chart, about the time behind the leaders for teams ranked 15th, shows that despite some waves going up and down, over time the time behind the leaders has slowly but steadily decreased, from about 500 seconds to between 250 and 300 seconds. That means the 15th ranked teams have gotten 3 to 4 minutes closer in the last 20 years.
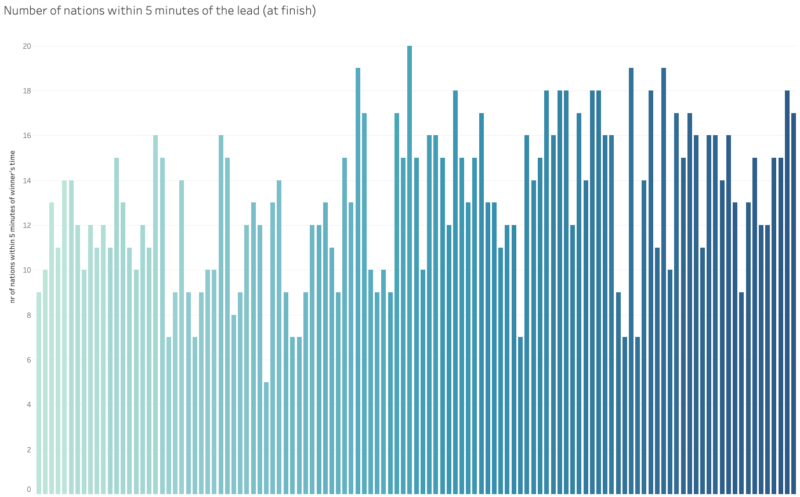
The second chart, with the number of nations within 5 minutes from the winning team, shows an even more wavy pattern. Since about 12-15 seasons ago, the general number of teams has been going up, ranging between 13 and 16, but from there it seems to have stabilized.
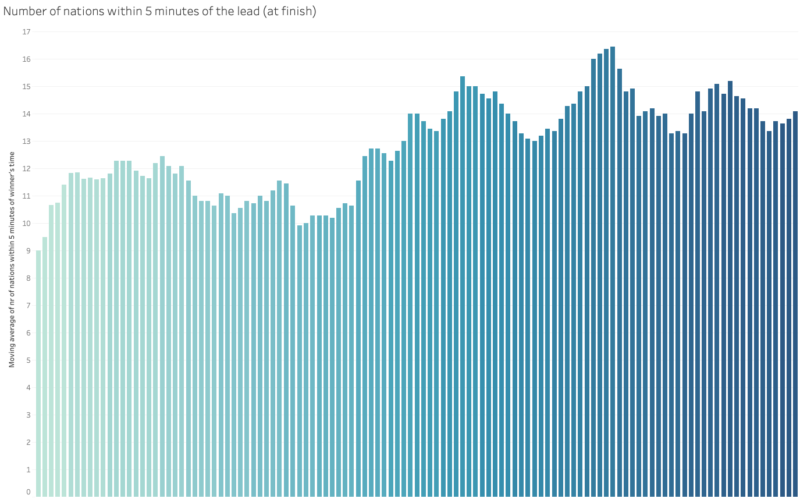
Overall, I think the “smaller” biathlon nations are getting closer to the leaders of the pack, and while the number of nations within 5 minutes of the lead appears to have stabilized in the last 5-10 years, they have grown to almost 15 in the last decade.
The women
The results are fairly different from the men. Around the 2012-13, 2013-14 seasons there was a significant drop off in the seconds behind the leaders for the 15th ranked teams, which pretty much stabilized in the 2016-17 season and is still at a similar level today.
Before we get into that a little deeper, we can see that in the chart above there are fewer races than in the chart below. This is because it looks at teams ranked 15th, and a significant number of races did not have a 15th ranked team at the finish (teams that get lapped by the leaders are taken out of the race).
Back to the chart. So since the 2016-17 season, the 15th ranked team was about 270~300 seconds or 4.5 to 5 minutes behind the winning team. Although following a different trend to get there, that is about the same distance in seconds for the men after they settled around the 300-second-level around the 2011-12 season.
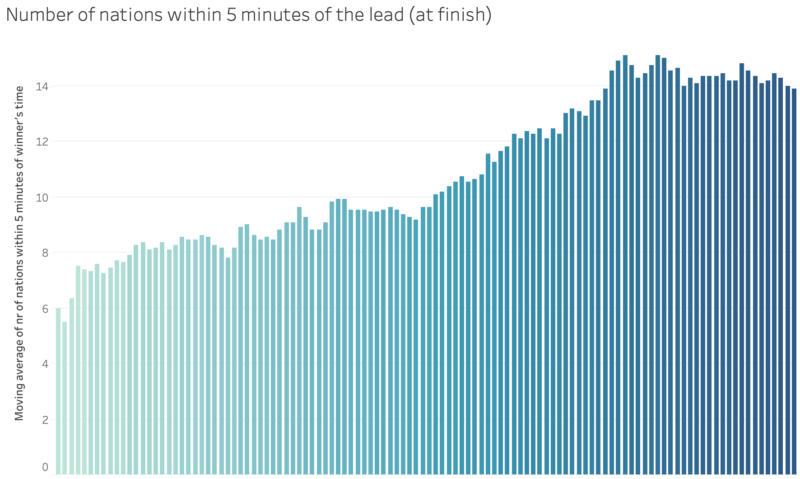
The number of teams within 5 minutes of the lead follows a very different trend compared to the men, and is a lot less wavy. Since the beginning of the data the number of teams within 5 minutes of the winners has been slowly increasing, with the start of a faster growth around the 2010-11 season and stabilizing around the 2018-19 season at the 14 team mark.
So with the women too, we see that the smaller nations have gotten closer to the top nations in the last two decades, but that the number of nations within 5 minutes of the lead has stabilized in the last 5 seasons.
What do you think? Would other ranks and seconds from the winner values be better to use for this analysis? Please let me know on Twitter or use the interactive version of this chart and see for yourself!