
(also posted on Real Biathlon Blog)
Depending on the event, biathlon athletes fire 10 or 20 shots per race, with the goal to a) hit the target and b) do it as fast as possible. At first thought, you would think the longer you take per shot, the higher your chances of hitting it. But further analysis shows that this train of thought could be wrong.
First things first. For this analysis, I used Real Biathlon data for the 2017-2018, 2018-2019, 2019-2020 and the first trimester of the 2020-2021 seasons, non-team races only. We’re talking 172,765 shots fired by both male and female athletes, of which 32,162 missed the target, a ratio of just over 18.5%.
But were those misses only influenced by how fast the shooter pulled the trigger after getting ready or the previous shot? And what other factors would influence the result of a shot, that we do and do not have reliable data on? First lap or last lap, being in front or behind, the weather (think wind, temperature, precipitation), visibility, the pressure resulting from race situations or proximity of other athletes, distractions from the crowd (when present), officials, other athletes, a miss disruption the flow, etc. With so many other factors, the shooting time clearly isn’t the only external factor influencing shot results. But it is probably one that athletes at least can try to control.
To analyze the shooting I looked at the result of each shot and how many seconds it was taken after getting ready (first shot) or after the previous shot (shots two, three, four and five for every shoot), the shot intervals. Those shot intervals are measured in tenths of seconds, so to make the data more manageable and understandable, the intervals are binned: group multiple similar shot intervals together in buckets. The following chart shows the number of shots per bucket (top) and the shooting percentages per bucket (bottom):

For example, bucket 4 shows all shots with an interval between 4 and 4.99 seconds: 8,120 shots in total fall in this category, and 23.8% of those missed the target.
If we look at the top part of the chart, we can see that the majority of the shots are fired within five seconds, or between 11 and 18 seconds. Clearly this is the general distinction between shots 2, 3, 4 and 5 and the first shots respectively.
The bottom of the chart shows the miss-rate: what percentage of shots were missed for a particular bucket. And we can see that the longer the athlete waits, the higher the miss rate becomes, up to seven seconds. My guess is that after holding their breath for seven seconds they have to take one or two breaths, which has a positive effect on the hit rate making it go down for a number of seconds. The increase in miss-rate starting around the 13-second bucket likely shows the same impact from holding the breath for the first shot, typically taken after about 11-12 seconds. Even longer shot intervals resulting in more misses could be explained by lack of confidence, legs starting to shake, athletes starting to think too much about their shot, self-doubt, etc. Also rifle malfunction can play a role here, specifically for the long shot intervals.
Now let’s look at some examples of individual athletes. To avoid confusion the following charts only look at shots 2, 3, 4 and 5, as the first shot takes much longer than these other shots.
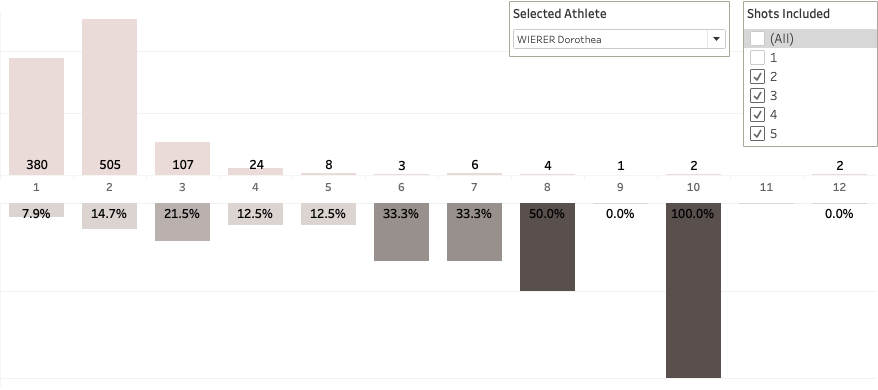
Wierer shoots fast and well, the majority of her shots in the one or two second buckets. It’s clear when things don’t go as planned and take over five seconds: the miss-rate goes up fast.
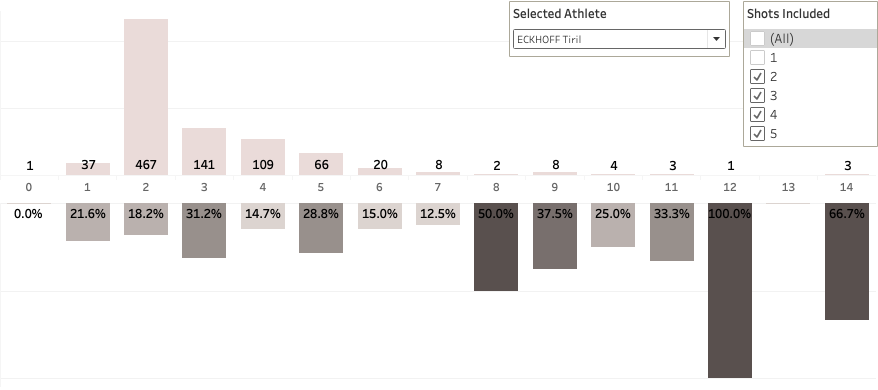
Eckhoff clearly takes more time, yet with a higher miss-rate. Only her 4, 6 and 7 second buckets have a miss-rate under 15%.
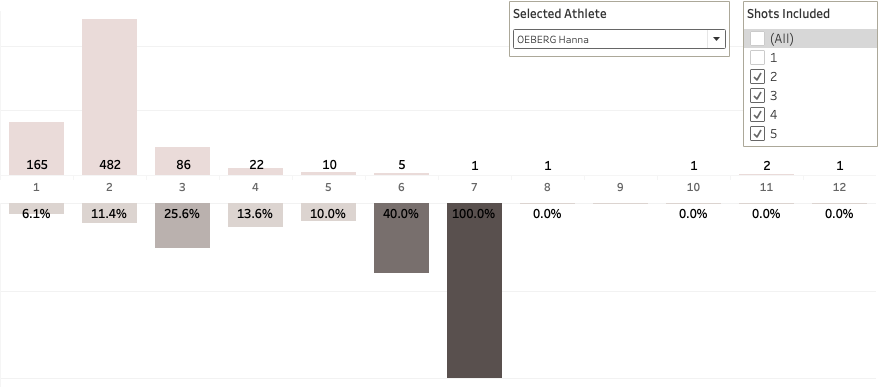
Hanna Oeberg is another fast shooter who does well in all buckets under 6 seconds except for the three-second bucket.
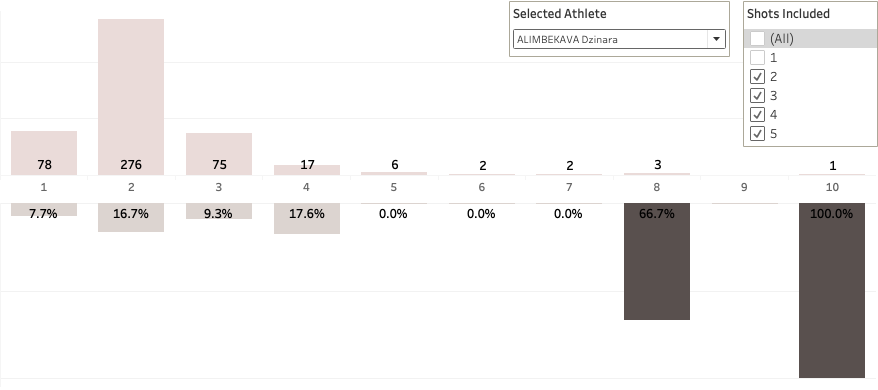
Alimbekava is also a fast shooter with almost all shots under 4 seconds. The miss-rate varies.
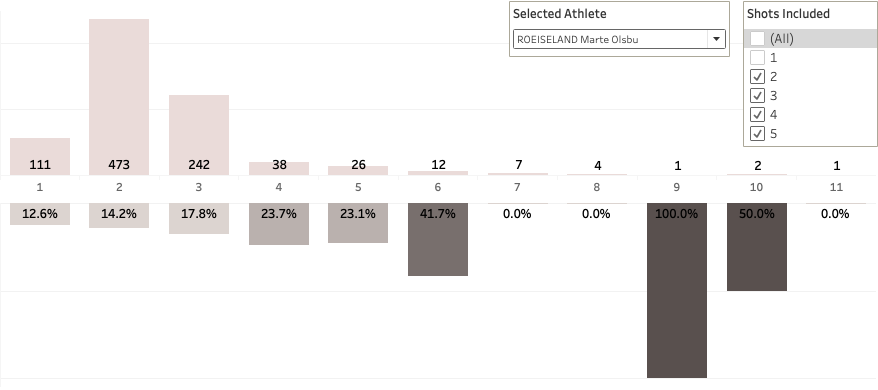
Roeiseland clearly takes a bit more time than say Wierer, and she shows a clear pattern: the longer the shot takes the higher the miss-rate.
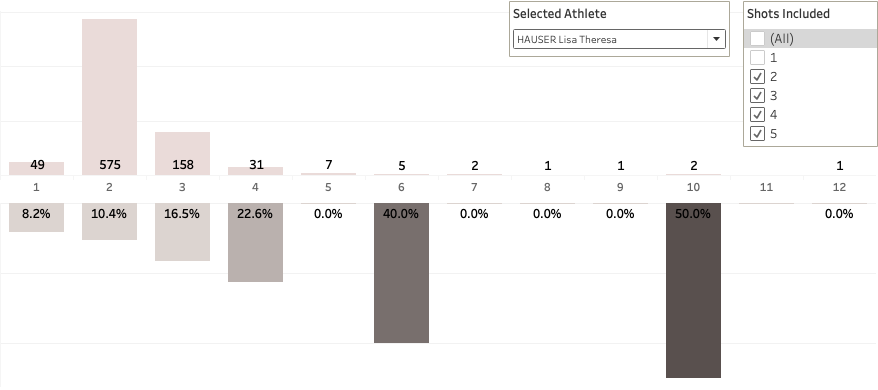
Hauser is another fast shooter who shows a clear pattern: under 3 seconds misses roughly 10%, the longer the shot the more she misses.
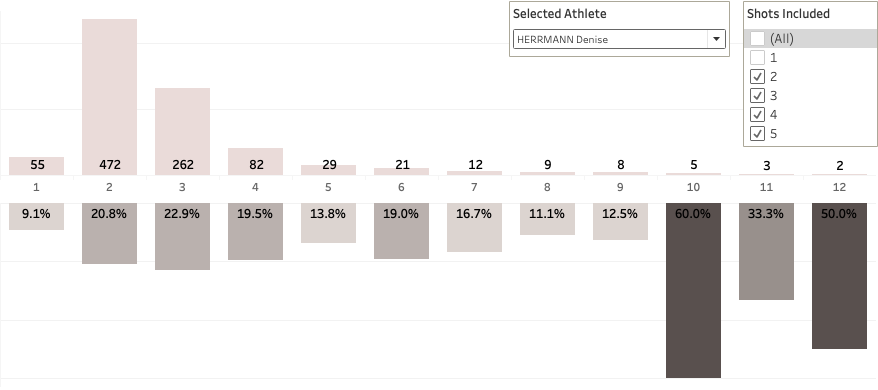
Super-fast skier Herrmann shows her generally higher miss-rate, but when shooting under 2 seconds actually misses less than 10%.
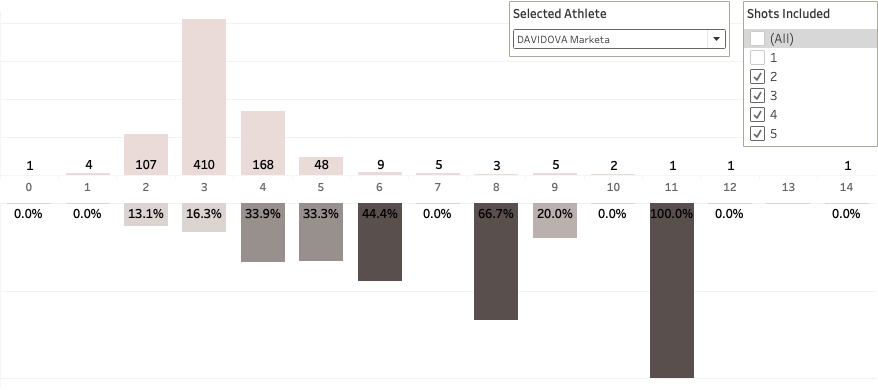
Davidova shoots quite slowly compared to the athletes above, with the miss-rate increasing as she takes more time.

Lastly, one of the best shooters in the current season, Zdouc initially shows the “expected” pattern: more time leads to less misses. But that only applies for the first three buckets.
Generally, it can be argued that the general expectation that taking longer for a shot leads to better results is not true for these women above. Now let’s look at the men:
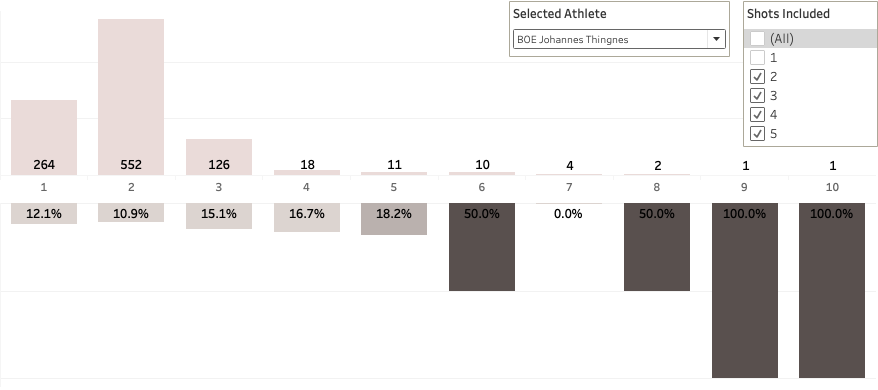
JT Boe shows good consistency (did I mention he leads the World Cup Standings?) up to 6 seconds, but he rarely takes that long.
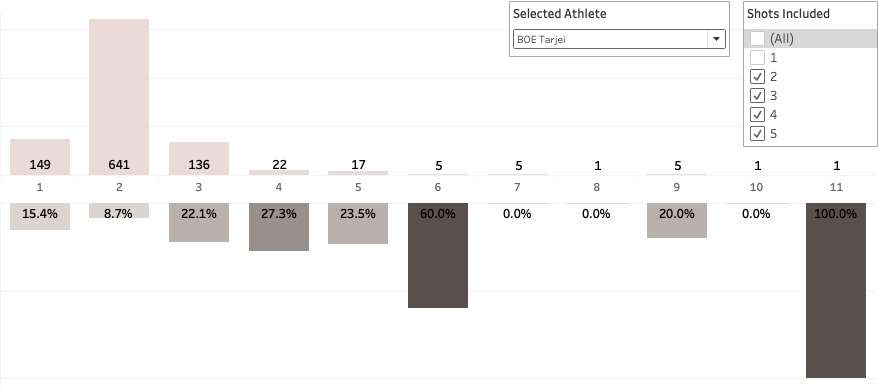
Brother Tarjei shows a very similar pattern, but with a higher miss-rate.
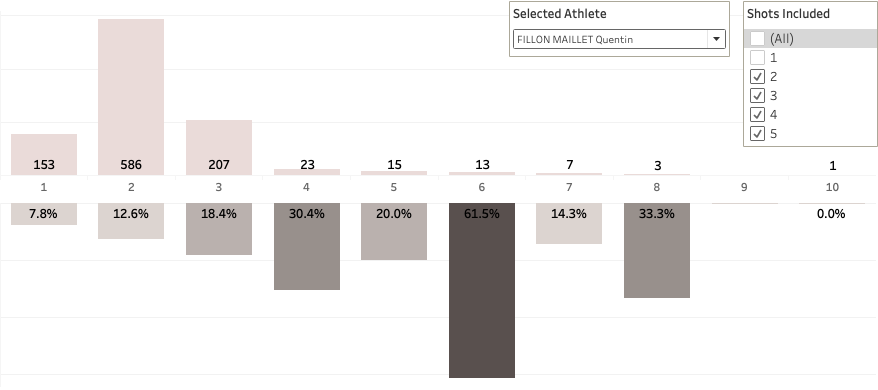
QFM shows the opposite again of the expected trend, the longer he waits the higher the miss-rate.
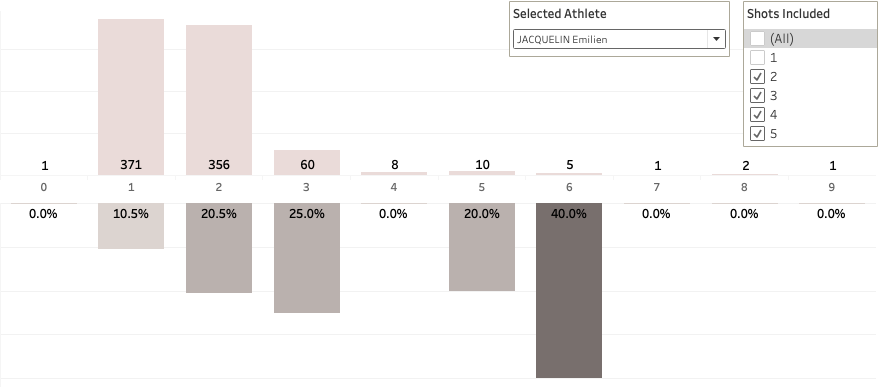
Fellow Frenchman Jacquelin never shoots under a second, but almost all shots under four. Again the rate goes up as the shots take longer.

Loginov is an extremely fast shooter, with almost all shots under three seconds. Based on his chart taking 4 seconds per shot could lead to great results (though based on a small sample size).
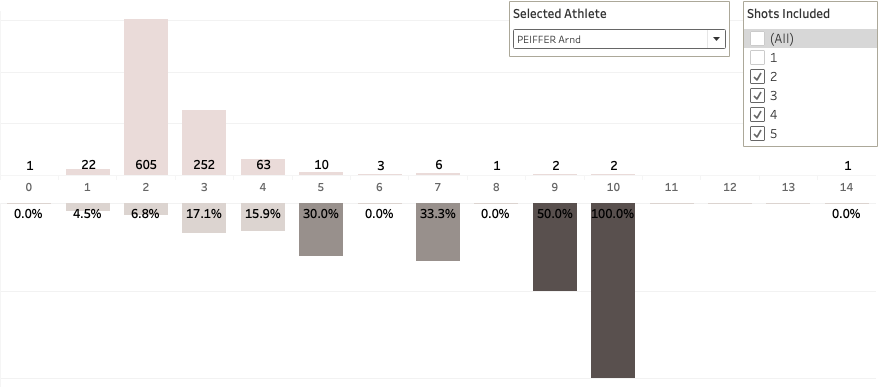
Peiffer clearly is one of the slower shooters, hardly ever taking less than two seconds. His miss-rates are good though, especially in the 2-3 seconds range which he is in the most, by far.
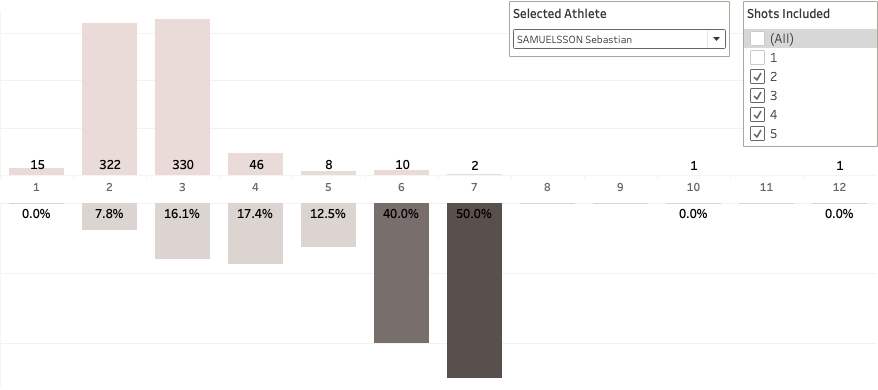
Samuelsson shoots very consistently in two or three seconds per shot, but as we have now seen many times, the longer the shot takes the higher the miss-rate.
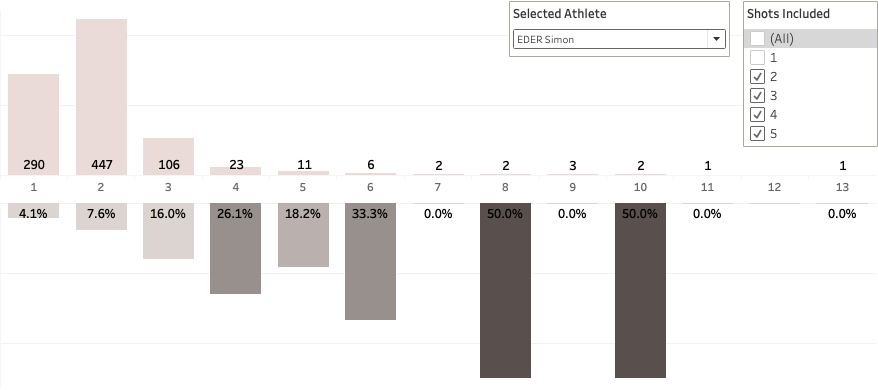
Eder, the leader of the Shooting Statistics list of the IBU, simply shoots very fast with a very low miss-rate. Again, even with the best shooter, the longer he takes, the higher the miss-rate.
Although all examples above don’t give a clear answer to what influences shot results, it is clear that taking more time per shot does not lead to better results. Of course, the athletes above are only a very small subset of all participants and represent the upper regions of the standings. But when going through the athletes in the lower regions of the standings the trend doesn’t change: taking more time per shot does NOT lead to better results.
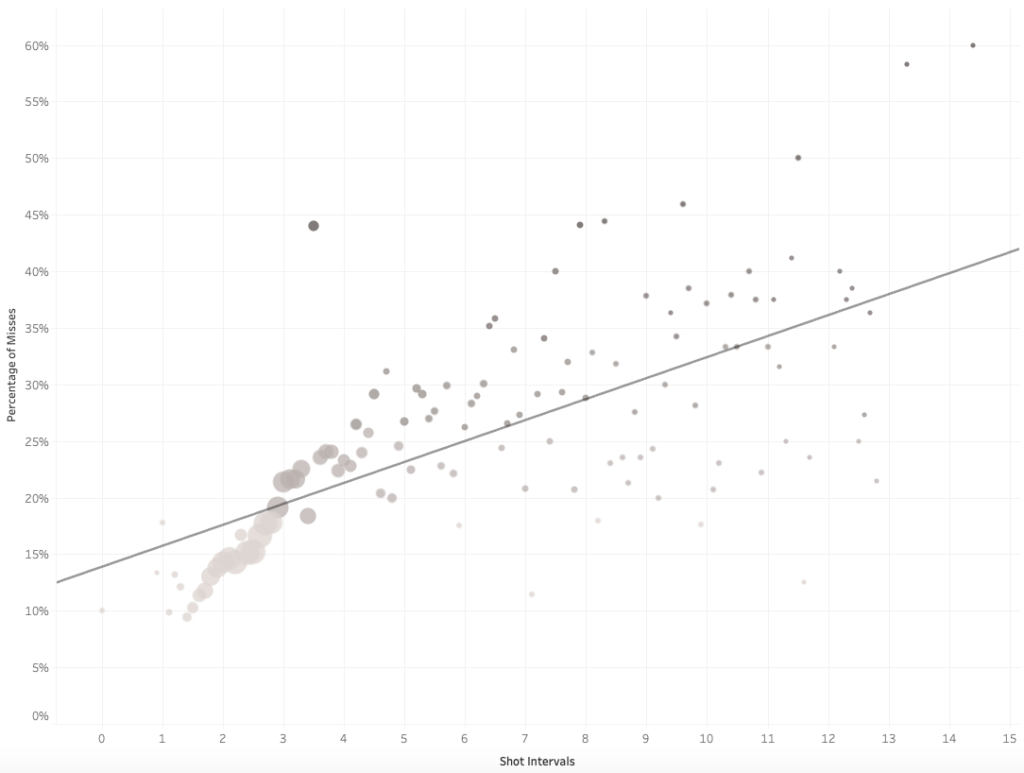
The last chart doesn’t use the buckets but looks at all shots per specific shot interval (remember, down to a tenth of a second) and the miss-ratio for that shot interval. Here too, I took out all first shots.

The trend is going up rather than going down, meaning more seconds per shot means more misses. Removing some of the shot intervals with less than ten shots gives a nicer picture, but with the same conclusion: taking more time per shot does NOT lead to better results:
On Tableau Public I uploaded a dashboard that shows the same data in a slightly different visual presentation, but it allows to filter for athletes, disciplines, stand or prone, etc. Go have a look a play around with it, and let me know if you find anything interesting.