
Long overdue, this short post helps users of the Youth and Junior Analysis and IBU Cup Analysis dashboards to use all features it provides. Since they work in pretty much the same way, I’m going to use the Youth and Junior Analysis one to demonstrate a few tips and tricks.
On the main page of the dashboard we have a couple of features:
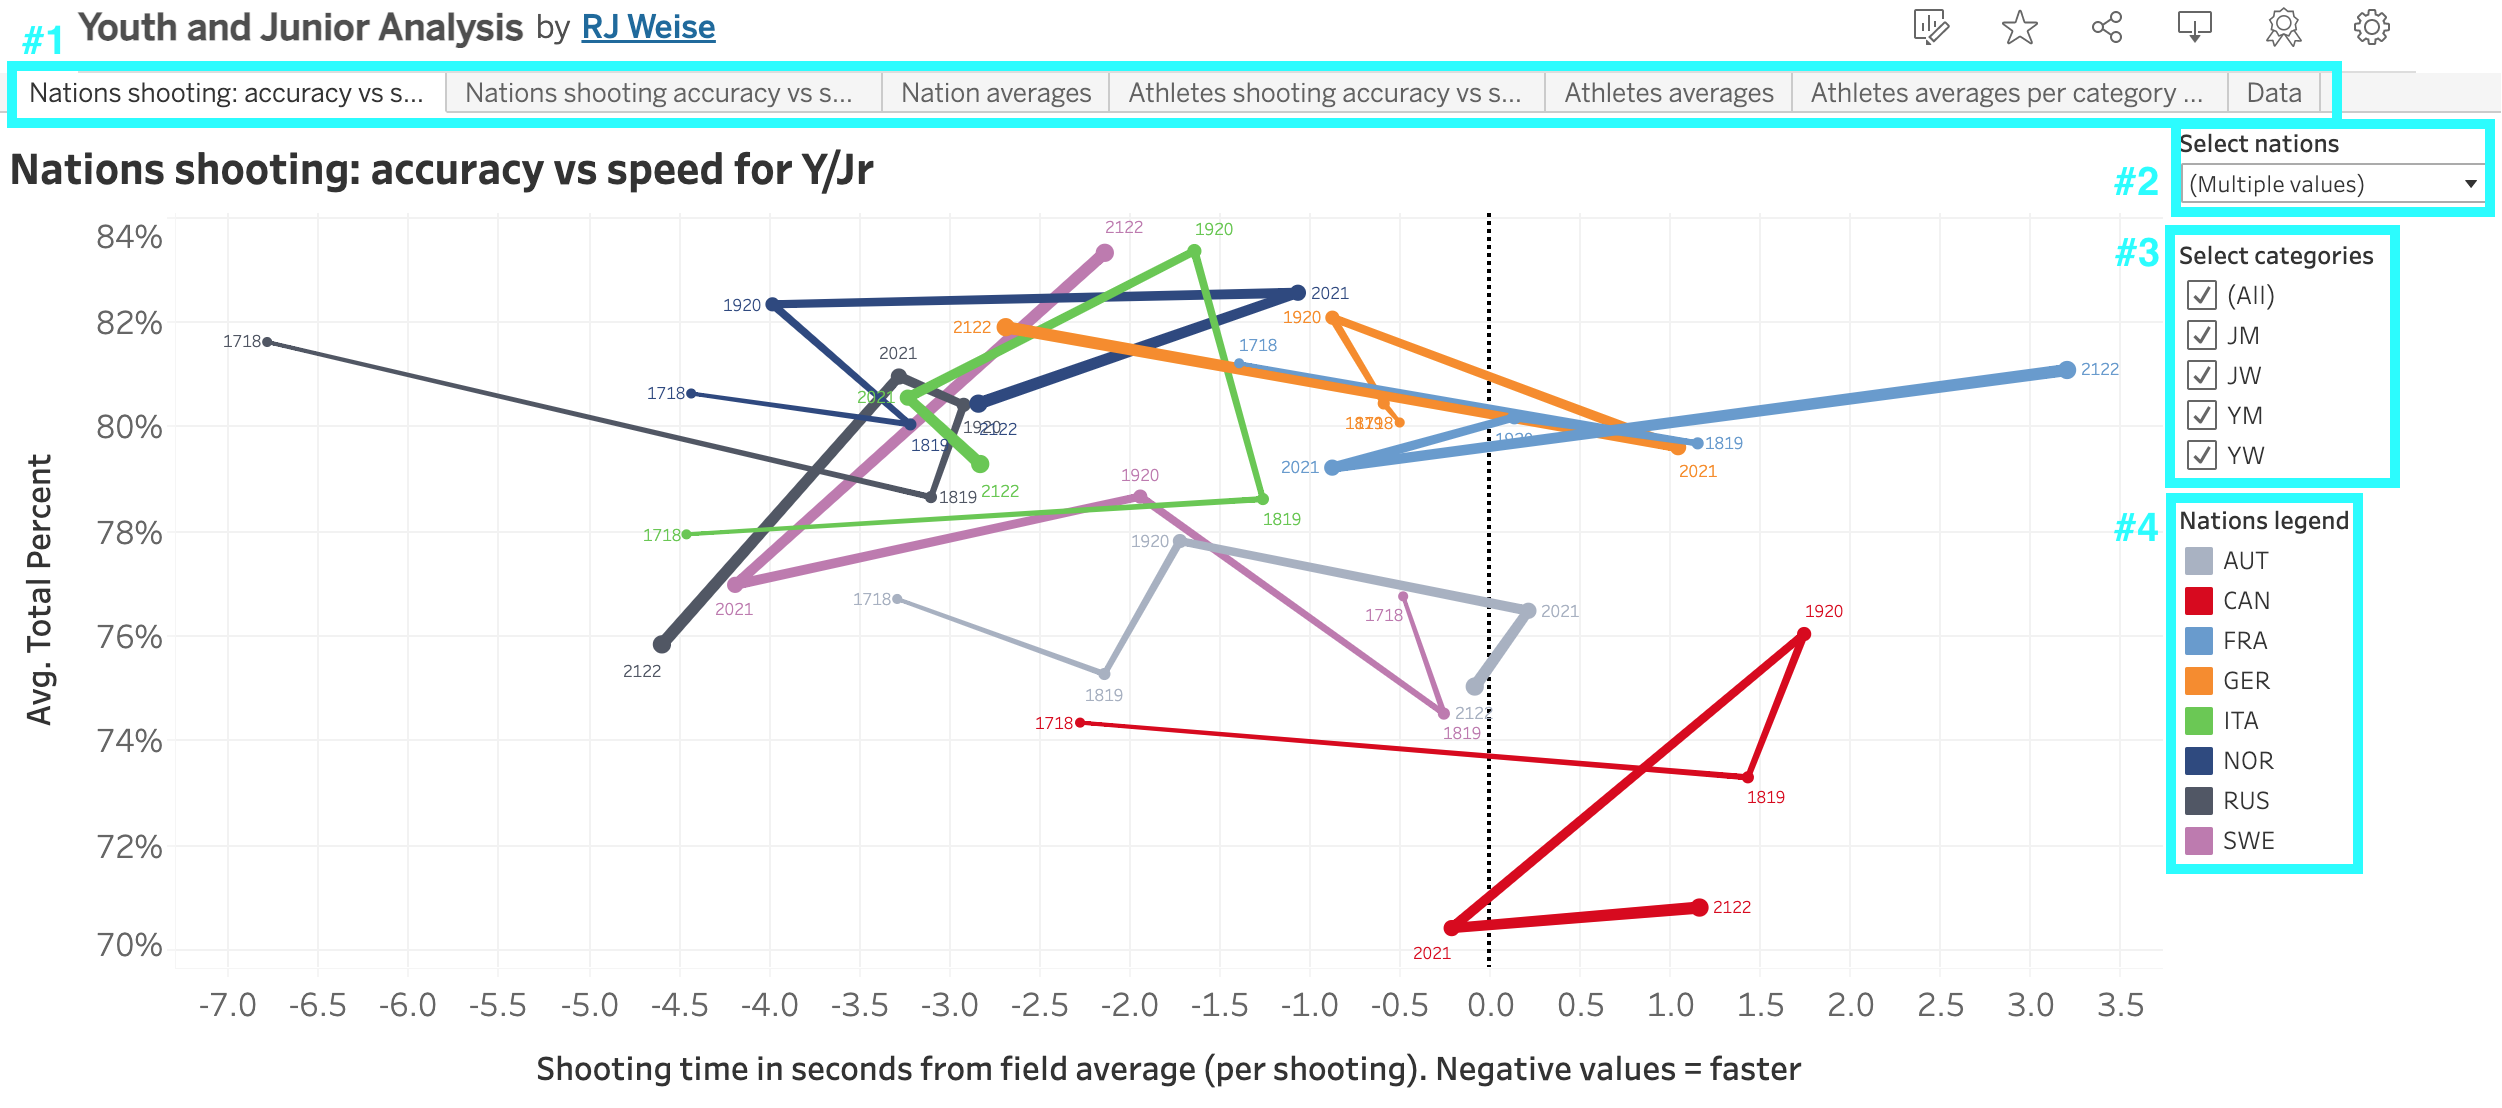
#1 Tabs. You would be surprised how the first tab is much more viewed than any other tab, likely due that many users just don’t realize there are multiple tabs. Note that sometimes when the dashboard has been open for a while, clicking on a tab may refresh the dashboard and go back to the first tab, so you’ll have to click the desired tab again.
#2 & #3 Filters. Pretty straightforward, there are dropdown filters (note the “(All)” option to turn all on or off, as well as the option to type the first few letters to filter the dropdown list), checkbox filters that are pretty self-explanatory, and slider filters on which users can move the slider or type a value.
#4 Legends. A good thing to know here is that by clicking on one of the listed items in a legend, it highlights the selected feature and greys out the rest.
Looking at the sixth tab of the dashboard, we see a more table-like visualization. Most of the columns can be sorted; text items are usually sorted by hovering over the header (#5) and clicking the little button that will show up, looking like AZ with an arrow. This will sort it ascending and descending.
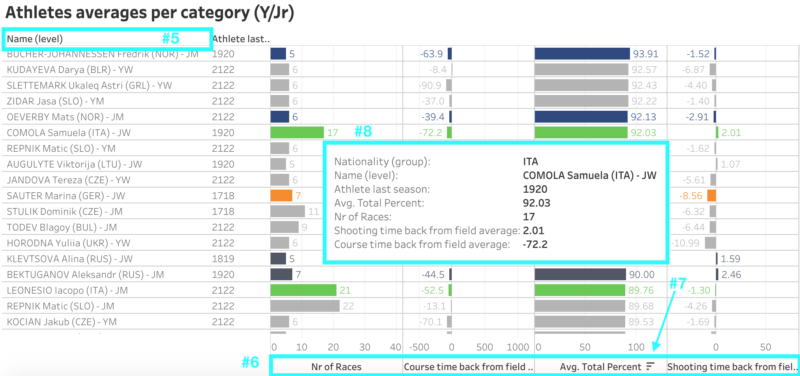
#6 Data items. These are often bars, lines, dots, etc. and they are sorted by hovering over the “headers” that are usually at the bottom. When hovering over them, a button shows up looking like three little bars (see #7) which allows you to sort the data ascending and descending.
#8 Tooltips. Most data points (in the example above the horizontal bars) will show additional information when you hover your mouse over them.
If you ever get “stuck” or want to reset the dashboards to its default state, just refresh the browser. And just for clarity, since I occasionally get asked, you cannot break the dashboard. A refresh will always bring you back to the default state.
Lastly, if you want to save the dashboard, you can click the download button (either top right above the dashboard, or bottom right) that looks like a rectangle with a small downward arrow, and save the tab that you are on as an image or a pdf.
I hope this helps you getting the most out of these dashboards. And the majority of these tips apply to all other dashboards as well, so have fun with it!