
As IBU ranking point systems vary over time and per level (Junior, IBUcup and Senior) and typically awarded only to the top 30 athletes per race, I created the Time Behind Score to compare performances between races in different seasons and at different levels.
The Time Behind Score is based on the idea that at every level, every athlete is trying to be the fastest and wants to avoid being the last athlete crossing the finish line. As not all historic data, nor the data for all levels include skiing and shooting details, this Score only uses the final time per race, regardless of the balance between skiing-time and shooting-results. Although this leads to a lack of depth for further analysis, it is the only way to compare between different level races from different eras, and in the end, the balance between skiing and shooting is less relevant when only interested in performance based on which athletes cross the finish first.
Calculation
For the Time Behind Score calculation, all total race times per race are converted to a 0-100 scale, where the fastest athlete gets a score of 100, the slowest athlete gets a score of 0, and all other athletes get a score based on the relative position between the fastest and slowest athlete. This also gives points based on relative times rather than a rank-score that ignores how much time difference exists between positions.
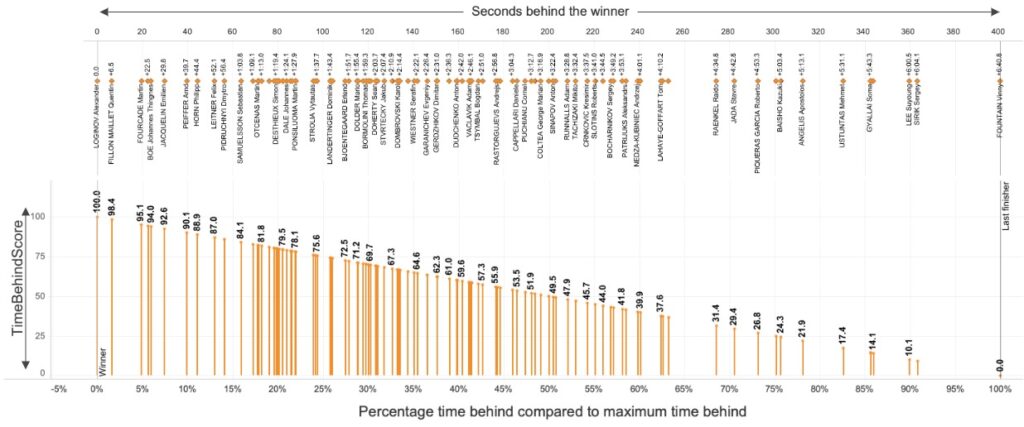
The figure below demonstrates the process of converting a race result to the Time Behind Score: the top half shows the race results of all athletes with the winner on the left and the last finisher on the right; the orange dots representing each athlete are placed depending on how many seconds they finished behind the winner (so the further to the right, the more seconds behind). Those “seconds behind the winner” are converted to a percentage between the winner and last finisher in the bottom half of the image (“Percentage time behind compared to maximum time behind”) with the winner being 0% and the last finisher 100%. The Time Behind Score is the inverse of this percentage, shown on the horizontal axis of the graph, so 100 for the winner and 0 for the last finisher:
When comparing race results between seasons and levels, I will be using the Time Behind Score as the measurement. I hope the above will sufficiently explain the reasoning and process to calculate these values. I understand that there are (as with any other scores) pro’s and con’s but I like the pragmatic idea of scores based on how the athlete did, compared to the rest of the field. However, any comments or feedback are appreciated!