
Introduction
My biathlon coach always tells me to see shooting as one shot at a time, rather than a series of shots. This is to prevent feeling more stressed about the fifth shot if the first four go down, and playing mind tricks if you miss the first shot(s), etc. By seeing them as individual shots, theoretically, they should all have the same odds of going down. But is that the case? Or is there certain pressure put on certain shots, based on the race standings and other circumstances at the time of the shooting?
About a month ago, the guys from Extra Runde (a great podcast with some English episodes worth listening to if you don’t understand German) asked me if I could “compare if there is a difference between 3rd and 4th shooting in mistakes. Especially when they’re shooting for the podium”. The latter part, shooting for the podium is not easily linked, but comparing between different shootings and shots is what I looked into below. It was interesting timing, as Penalty Loop had also mentioned on Twitter that it would be good to look into relay pressure. But unfortunately, that will have to wait until another article, as I focus only on non-team events in this one.
So, the goal of this article is to analyze individual shots in biathlon and see if every shot has the same chance of being a hit. I also want to see if we can use that data to say something useful about shooting pressure in biathlon. I want to reiterate that as I mentioned in other articles, biathlon is a sport of many, many factors. So to hope that any single event could explain something like shooting pressure would be ignorant. But perhaps we can see if these single events are likely to contribute to shooting pressure.
Data
I looked at five seasons of non-team races (with the current season only including the first 4 events), analyzing every single shot that was fired (227,227 data points!) by athletes that finished the race. The race disciplines included are Sprint, Pursuit, Individual and Mass Start.
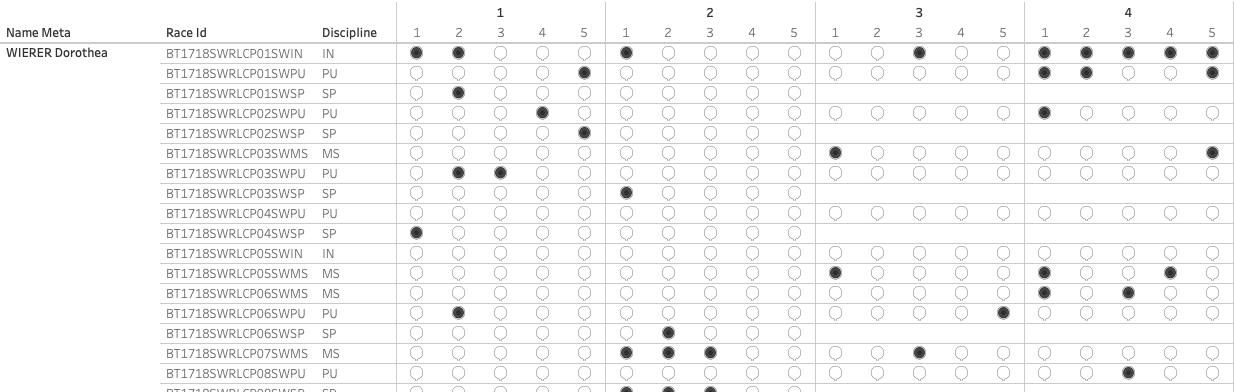
Shot codes
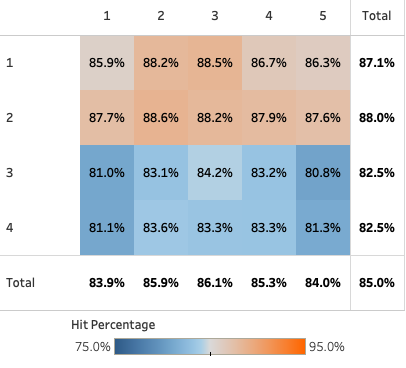
We know that not every shooting and shot is the same, and we know that prone shooting generally has better hit rates than standing shooting. As race disciplines have different shooting orders, the second and third shootings can be prone or standing. To deal with that issue I assigned a shot code to every single shot. For example, shot code PU-3-4-S-1 tells me it was a Pursuit race, third shooting, fourth shot, standing position, hit. Based on these codes I can tell you that the Mass Start, first shooting, second shot in the prone position has the highest hit rate of 86.8% for the whole field of athletes that finished the race. And the Sprint, second shooting, first shot in the standing position the lowest, at 75.6%. If we take all these shots and average them per shot code, we can then throw it into a matrix we get the following:
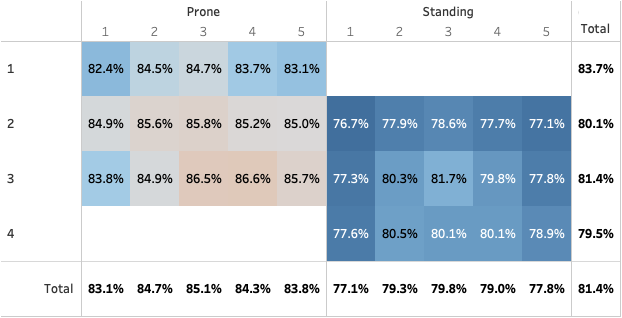
As you would expect, generally speaking, the averages for standing shots are lower than the ones taken in the prone position. For prone, the lowest hit rates are the first and last shots of the first shooting and the highest are the third and fourth shots of the third shooting. In Standing shooting the lowest is the first shot in the second shooting where the highest is the third shot of the third shooting.
Filtering the data
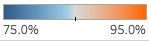
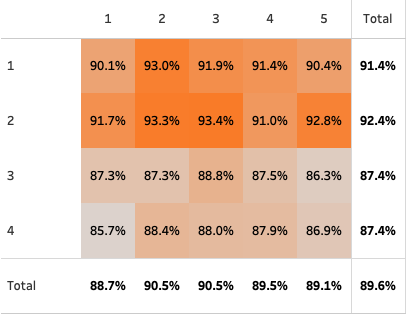
One thing to remember is that by including all athletes we’re only taking 30 in Mass Starts, between 50 and 60 in the Pursuits, and around one hundred in Sprints and Individuals. This makes the Sprints and Individuals way heavier on the results. So let’s look at the same matrix but only include the top 30 ranked racers with the same colour scale:
As we would expect by only taking the top 30 athletes, the numbers are quite a bit higher than the chart showing the whole field of athletes. For prone we see a similar (but not quite identical) pattern compared to the previous chart, but the standing position looks quite a bit different in pattern with the fourth shooting clearly being the better of the three shootings in the standing position.
Shooting pressure
Since one of the goals is to look at shooting pressure, and as it is kind of hard to look at the data for prone and standing separately, I’m going to look only at Pursuits and Mass Starts, for the top 30 athletes. This gives me data with all shots in the same order and shooting position, and realistically you would expect more pressure when racing (wo)man to (wo)man, rather than against the clock. That leaves us just shy of 100,000 data points (shots) for the following chart:
Since the shooting order and positions are the same we don’t have to separate the prone and standing anymore, knowing that the first two shootings are in the prone position and the third and fourth in the standing position.
We can see that for all four shootings the first and fifth shots have lower hit percentages than the other shots. And, as we discussed before, the prone shots are better than the standing shots. But if I had to look at this chart from a pressure standpoint, I would expect the fourth shooting to be worse than the third, which it is not.
One more thing we can try is to look only at the top 10 athletes, based on the debatable assumption that if you are out of the top 10 there is less pressure.
Although the averages are higher, as we would expect since we are looking at the “creme-de-la-creme” of biathlon, the general pattern is the same. The second shooting is the highest, and the third and fourth are the lowest (and have the same average). And, for the third and fourth shooting, the first and last shots are the lowest again.
One could argue that the fourth shooting is the one that has the most pressure, as it is the final shooting. And I can somewhat see why the first and last shots would be the most pressurized of them all; first coming into the stadium and last because, well it’s the last of the race. But it would be far too easy to assign these numbers directly to shooting pressure alone, as there are so many other factors in play (did I mention that already?) that also have an impact on the hit percentage for any shot. Think of crowds, conditions, etc.
Conclusion
So, although we cannot conclude that the data above tells us anything specific and directly related to shooting pressure, it gives us some interesting information. And it isn’t necessarily completely unrelated to shooting pressure either. But we can conclude that one shot is not the same as the other, even when in the same shooting position. Now the question is: is my coach is onto something new, or do biathletes just not listen to coaches when it comes to shooting one shot at a time?
Use the interactive charts on my Tableau Public site to look for your athlete of choice! But keep in mind when doing so the datasets may be limited.
Did you like this article, or do you have any comments or feedback? Please let me know on Twitter!