
Football and baseball are huge sports in the fantasy sports world. Biathlon is not, however that doesn’t mean it is not there at all. For example, the sports department of the German television corporation ARD has what they call the Biathlon Tipp Spiel, freely translated as the biathlon guessing game. It allows participants to predict the top 5 of any upcoming race in the IBU World Cup circuit, and although thankfully biathlon is unpredictable enough to make this pretty hard, I wanted to have a quick look into previous results to see “who’s hot and who’s not”. The following blog-post describes the steps I took to create the Puck Possessed Biathlon Athletes Research Tool on Tableau Public. For those of you who eagerly clicked on the link, please be patient as the data loads 3+ season of detailed race results. Update: I created a clone that eliminates the 2017-2018 season, resulting in better performance of the dashboards.
The data
Since the Real Biathlon data is now available through Patreon, I downloaded some of the more current race results using R. Now, there are many other coding languages and ways to do it, but since I’m most familiar with R, that is what I used. The following paragraph is a description of how the get the data using R (assuming you have a subscription). If you’re not interested in the technical stuff, skip right ahead to the Data Visualization section below.
First we need to connect to the Mongo Data base with the username and password that comes with the Patreon subscription:
install.packages("mongolite", "tidyverse", "dplyr", "jsonlite")
library(mongolite)
library(dplyr)
library(tidyverse)
library(jsonlite)

# Set username and pasword
mongousr <- "--your username--"
mongopw <- "--your password--"

# Set the collection, database and prefix to create the url
rbcol <- "RacesList"
rbdb <- "Results"
rbpref <- "biathloncluster-ay3ak"
rburl <- paste("mongodb+srv://",mongousr,":",mongopw,"@",rbpref,".mongodb.net/<dbname>?retryWrites=true&w=majority", sep="")

# Use the URL created above to connect to the correct MongoDB data
rbmongo <- mongo(collection = rbcol, db = rbdb, url = rburl, verbose = TRUE)
Now we can connect to the database. To gather all the data I wanted for my dashboard, I first got data that had all raceIds I wanted to download. Then I created a loop to go through these raceIds one by one and download the file. Below is just the code to get one single file into Tableau. Perhaps I’ll show the loop code in another blog post sometime.
# Get data from the Mongo connection created above by searching for one specific raceId
RaceBT2021SWRLCP01SWSP <- rbmongo$find('{"raceId" : "BT2021SWRLCP01SWSP"}')

# Convert the file to json
RaceBT2021SWRLCP01SWSPjson <- toJSON(RaceIdString)

# Write the json file to your computer
write(RaceBT2021SWRLCP01SWSPjson, "RaceBT2021SWRLCP01SWSPjson.json")
And that is all it takes to connect, load a file and save it as a json file. One could also save as a flat csv file here, but to do that you will have to manipulate the loaded file first as it comes with nested data, multiple levels deep. Since Tableau Public reads json files natively, I decided that using the power of Tableau Public is far more time-efficient.
Data visualization
Although the above code generates one json file for one race, for my specific dashboard I got a file for every race since the 2017-2018 season, creating over 200 files. With those sitting on my hard drive, eagerly awaiting to be visualized, do the following:
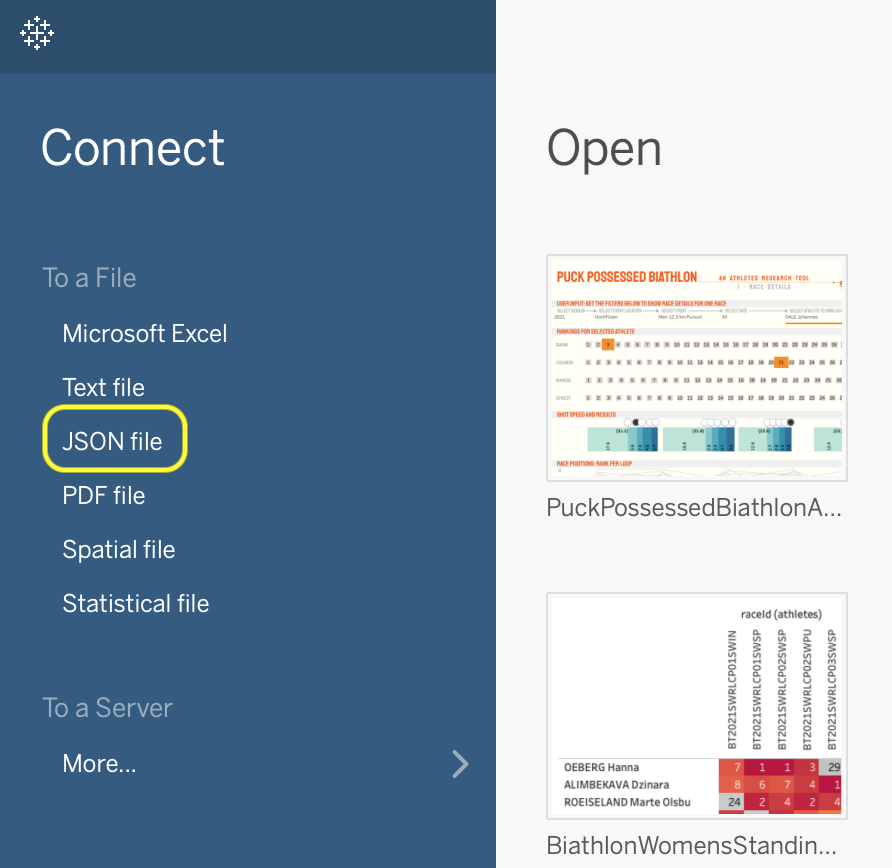
Open Tableau Public and connect to a Json file
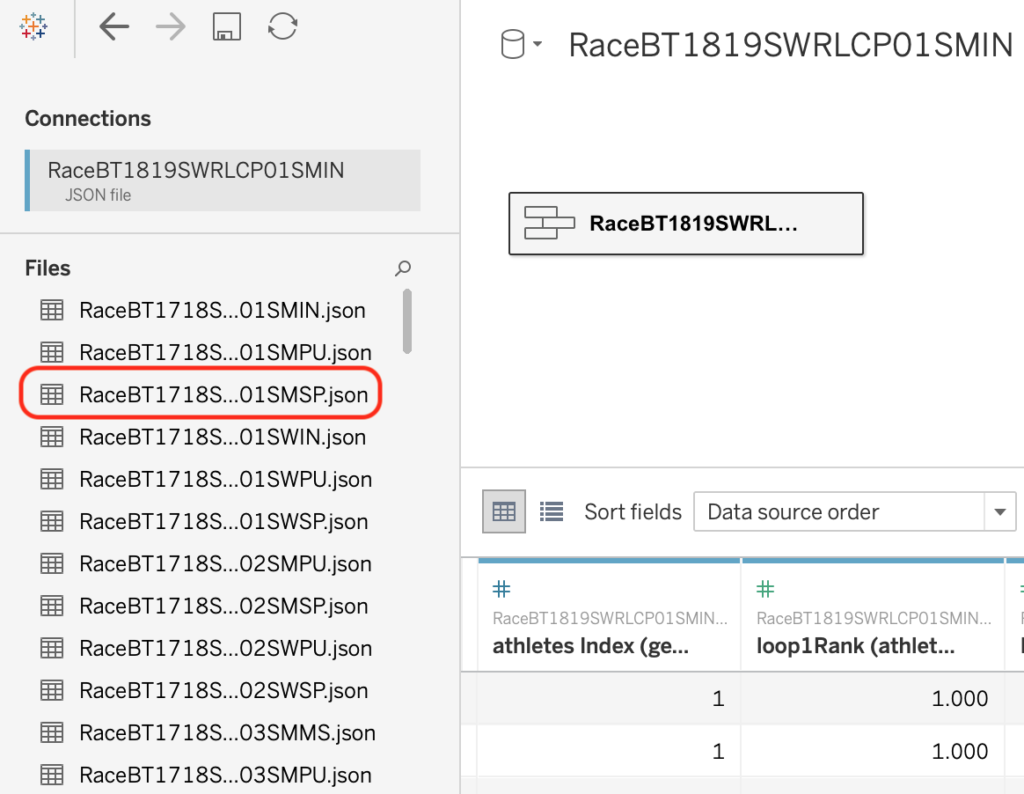
Select one json file specifically
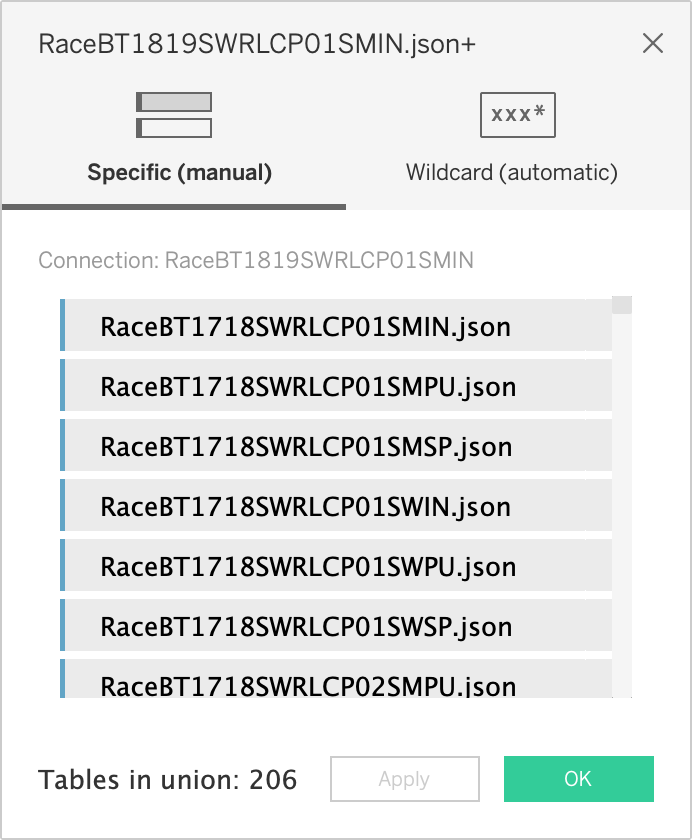
Drag all other json files (I assume all files are in the same folder as the first file) right below the one file from the screenshot above
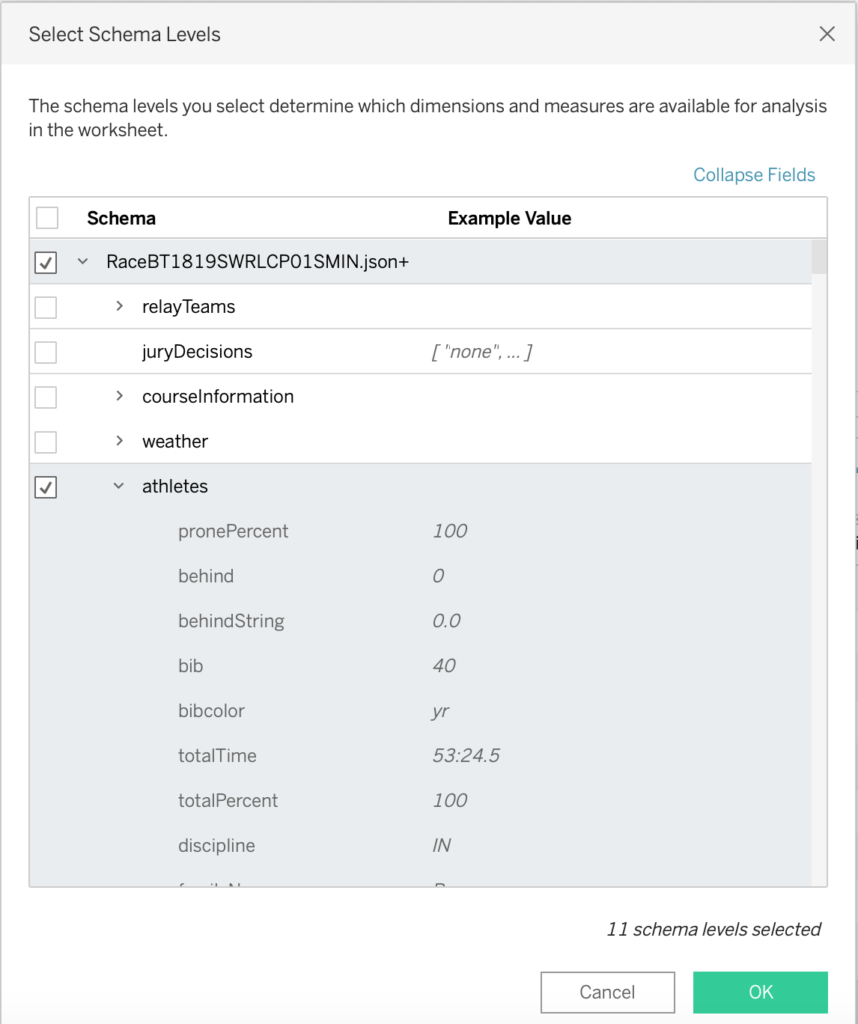
Select the Schema Levels to only get the data I want to use (resist the temptation to select all when you see all the goodness that is available in these files, and stick to the KISS principle)
Now you can create a new Sheet and start on your visualization. I must admit working with the nested json files takes a little time to get used to if you are used to dealing with flat files, but in the end it works quite well!
Since I wanted to have information on athletes specifically to help me pick future winners, I wanted to make three levels of information, or dashboards: one for one race, specifically the most recent one or the most recent of the same type and on the same location as the one I’m predicting for, one to show me current form by looking at the results for the current season to date, and one for similar events in the past (so all sprint races in the last couple of seasons, or all races in Hochfilzen, etc.)
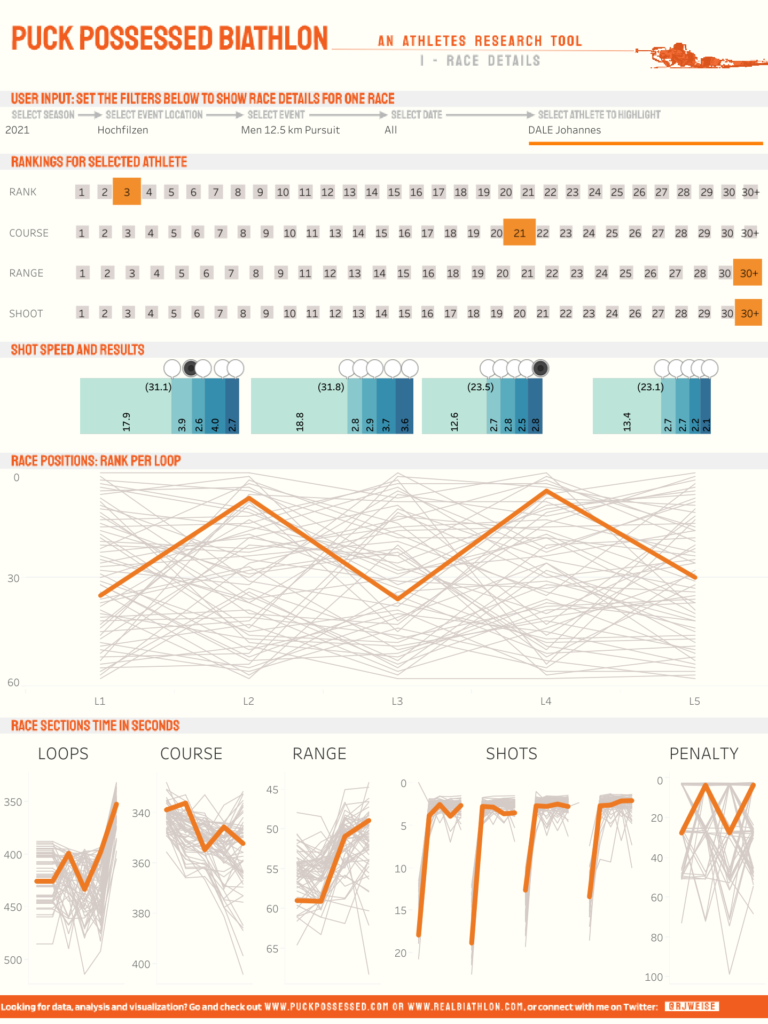
Tab 1 Race Details shows infomartion for one race, while highlighting one athlete of choice

Tab 2 Current Season Information shows information about the selected athlete that gives the reader an idea if the athlete is hot or not, or on an upward or downward trend.
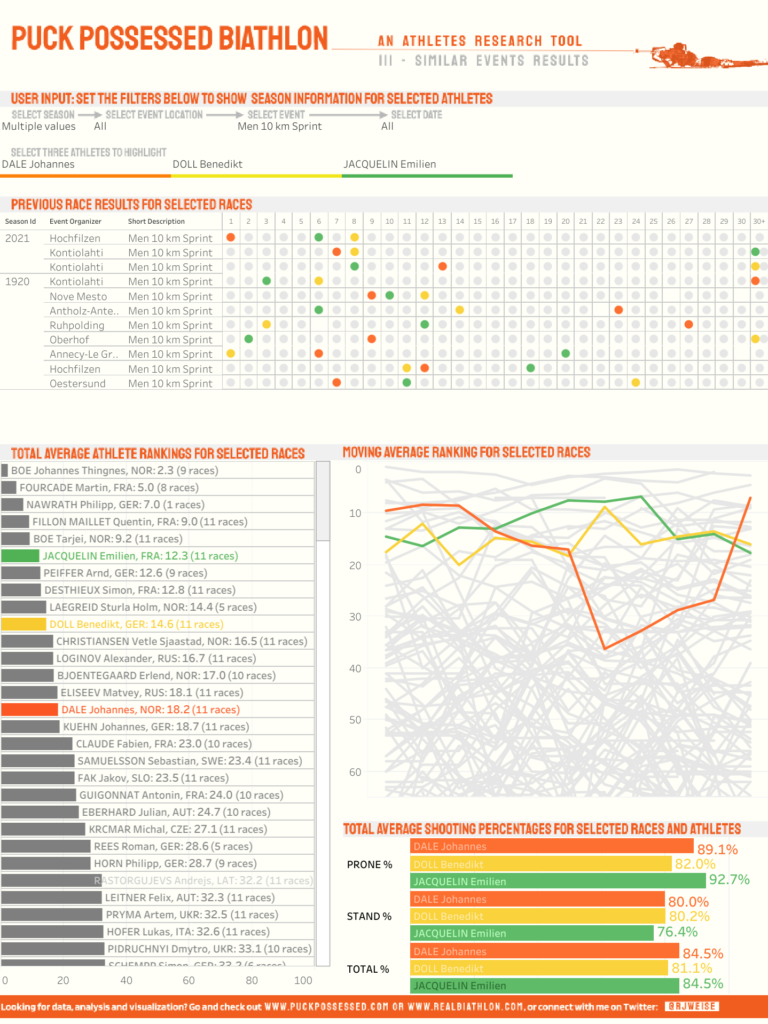
Tab 3 Similar Events Results shows how athletes have performed in previous similar races as the one you are predicting for.
So please go have a look at the dashboards (full and small) and let me know what you think. And good luck making your own dashboards based on the real biathlon Patreon data subscription!