One Track, Two Levels: Imagining the Future of Biathlon races.
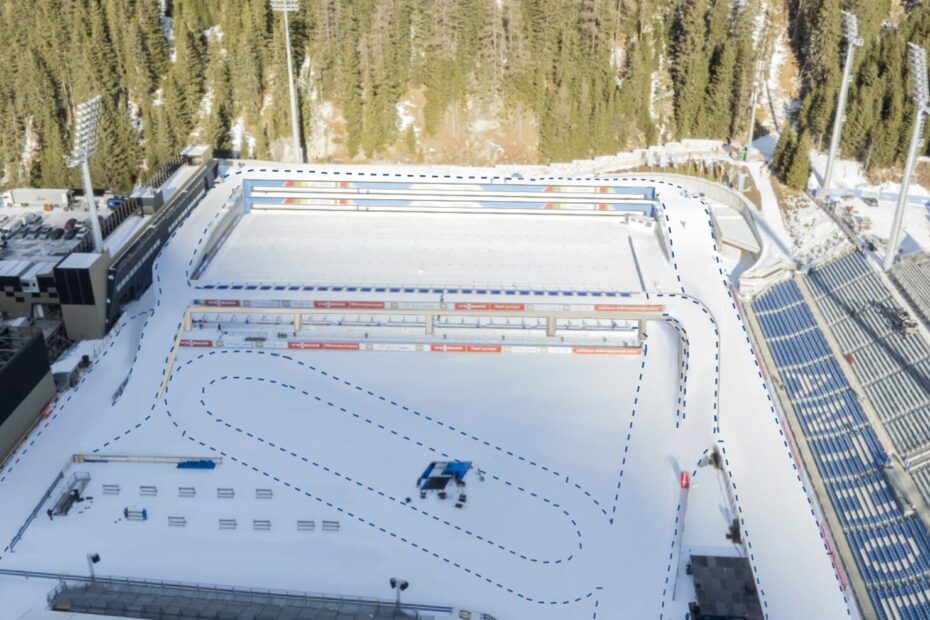
For decades we have seen them. To accommodate growing numbers of golfers yet limited space, driving ranges have gone vertical. Adding one, or sometimes two, layers of hitting spots, the capacity doubles without increasing the footprint of the building. So why do we still only have 30 racers in the Mass Starts, and 60 in the Pursuit? The Mass Start 60 is being “tested” on the IBU Cup, and it’s great that the IBU is looking into opening this race up for more competitors. But the one part that makes the Mass Start so much fun to watch, and easy… Read More »One Track, Two Levels: Imagining the Future of Biathlon races.