
Introduction
History
For many years, sports data analysts in numerous fields have used results from the past to predict outcomes of similar situations in the future with a specific level of certainty. In baseball, for example, one can foresee the outcome of an at-bat with specific parameters (2 strikes, 2 balls, 1 out, batting right, pitching left, and a score of 4-2 in the 7th inning) based on all similar situations in previous seasons of baseball. In (ice-)hockey one can do the same when looking at the shot location, the period and the current score with a specific goalie in the net, or the home-team win expectation based on a certain score and with a specific amount of time left in the game. All in all, there is a long history of using historical results to predict future ones. The article below takes a first stab at doing something similar for our beloved sport biathlon.
What is W.E.I.S.E.?
Since the end of the 2021-2022 season, I have been working on The Win Expectancy Index based on Statistical Exploration, W.E.I.S.E. or WEI for short. It uses results from previous biathlon races to predict with a level of certainty what the outcome of a race can be. Unlike baseball, and to some degree hockey, biathlon doesn’t offer its data ‘live’ during a race, but we can still use the WEI to analyze athletes’ performances while comparing predicted results and actual results, look at the strength and weaker points of an athlete during a race, and what component of the race to focus on, to name a few.
The WEI only just sprouted, and I’m already claiming quite the impact and outcome of it! Please don’t take me too seriously (but please, also don’t take me not serious at all). Although I highly value data and statistics in sports, I fully realize they are just one of the means that can be used for analyzing biathlon, and do not replace but rather enhance any other type of analysis. And outcomes are just predictions based on other events that, on paper, are the same, but in reality can be quite different, and as such, while providing value, should be taken with a few grains of salt.
Goal
My goal with the WEI and this article is to share my thoughts, describe the creation process and explain its possible applications. And by doing so I hope to get your interest and provide me with feedback. Yes, I am highly interested to hear your thoughts, know if you see any value in the WEI, and read about what thoughts you have when you read this! (fire me a tweet if you care to share!) In the end, I want to keep improving, updating and refining the WEI, and getting different perspectives will help that tremendously. And although it would sadden me after double-, triple- and quadruple checking everything, if you do find anything wrong or broken in the process described here or the index demonstrated further down, please do let me know.
Data
Basics
The basic data for this article are the individual race results on a participant level, as gathered by RealBiathlon, for all seasons starting in 2001-2002 up to and including 2021-2022. From all those races, the following results were excluded: Null (no values), DNF (did not finish), DNS (did not start), DSQ (disqualified), and LAP (lapped).
To give you an idea, we are talking about 1,068 races in total (136 individual, 200 mass starts, 328 pursuit and 402 sprint races. All these races had a combined total of 76,712 participants, 1,143,230 shots and 226,896 misses (19.8%).
Key statistics
For the first version of the WEI, I focus on two specific statistics that greatly impact the results of a biathlon race: ski speed, expressed in course time, and shooting, expressed in misses. Since I want to be able to look at win expectancy at every end of a lap (post-shooting) I calculated cumulative misses per lap and cumulative course time per lap which I then ranked.
(Re-)Calculations
I also (re-)calculated final race ranks and points, for a number of reasons:
- First, I wanted to include Olympic Races for which no World Cup points are rewarded
- Second, when using such a long time period, some point rewarding rules may have changed, so I wanted the points to reflect the current rules for awarding points
- Third, as pursuit races can be heavily influenced by start times, I used the isolated times (actual race time ignoring start time differences) and calculated the final result rank and points.
Note that this last item can lead to odd-looking results, but please trust that the calculations are fine. For example, we know that Quentin Fillon Maillet won six pursuits in a row this season (including Olympics). However, his isolated results in those races were 5th, 2nd, 3rd, 14th, 3rd and 7th.
Data kaputt?
When looking at data for the 4th and 5th laps, some sprint races may appear to be broken. This is not the case but due to being the only discipline that only has two shootings and three laps. In the dashboard I share below I have made sure sprint races are not shown for laps four and five, but when more charts become available in the near future, you may see some oddities for laps four and five in sprint races. Now you know what causes it.
Unfortunately, some races are missing course time data for certain or all participants. This was likely due to broken time tracking equipment or ankle straps on the day of the race, or someone forgot to turn on the trackers, or something comparable. Since this data is actually ‘kaputt’, these results were removed from the dataset, as nulls can not be used in the calculations and counts (118 participants in total).
Analysis
Levels of detail
Based on the data described above, I wanted to create this first version of the WEI with cumulative misses and cumulative course time combinations, that possibly could be generalized in bins. As we are only able to look at results per lap, we don’t have the luxury of generating a huge number of historical results as they do in baseball for example. To ensure a decent sample size is available, grouping ski rankings in bins seemed to make sense. I also wanted to make sure that the resulting dashboards would allow users to look at the data as a whole, per gender and per discipline.
Calculating Win Expectancy
After organizing all the data in such a way that I had combinations of race/athlete/lap/cumulative misses/cumulative ski time rank, I could then calculate the total occurrences of these combinations, as well as the total number of race winners with those combinations.
For example, after the first lap, the most occurring combination was that of 535 participants with zero misses and ranked 13th in ski time, of whom 35 ended up winning the race. The Win Expectancy (WE) for that group would be 35/535 = 6.5%. Not surprisingly, the 501 participants without misses and ranking first in ski time after the first lap had the highest WE, with just under 30%. These WEs are still relatively low, as they are calculated after the first lap and shooting. A lot can still change, especially in the race disciplines that go five laps.
Reliability
The sprint races, only having three laps (while having the most participants), will have their most reliable WEs after lap three, when both their cumulative misses and ski time rank will no longer change. The athletes in all race disciplines with zero cumulative misses and ranked first in cumulative ski time after lap three have a 76.4% chance of winning (94 winners out of 123 athletes in total), based on historic results. If we look at athletes after lap three in sprint races only, the WE goes up to 89.6% (69 out of 77).
Sample sizes
The more specific we get with regards to race parameters, the fewer athletes and results we will have to compare to (smaller sample size). Especially when we look at mass starts, as those races already have a reduced number of athletes only starting 30 per race. For example, when we specifically look at the combination of the mass start discipline, women, one miss and ski time rank five, we will only find ten athletes (of whom two won, so the WE for that group is 20%). And as we go further down in misses and rank for that group, say for six misses and ski time rank 18, we only have four athletes.
Bins
To address this we can use bins for the ski time rank, groups of values close together. So far I used bins with a size of five, combining all athletes from the same original group above (mass start, women, one miss) in ski time rank groups of 1-5, 6-10, 11-15, and so on. The ten athletes we found with one miss and ski time rank five are now in the group with one miss and ski time ranks 1-5, giving us 68 athletes including 27 winners, for a WE of 39.7%.
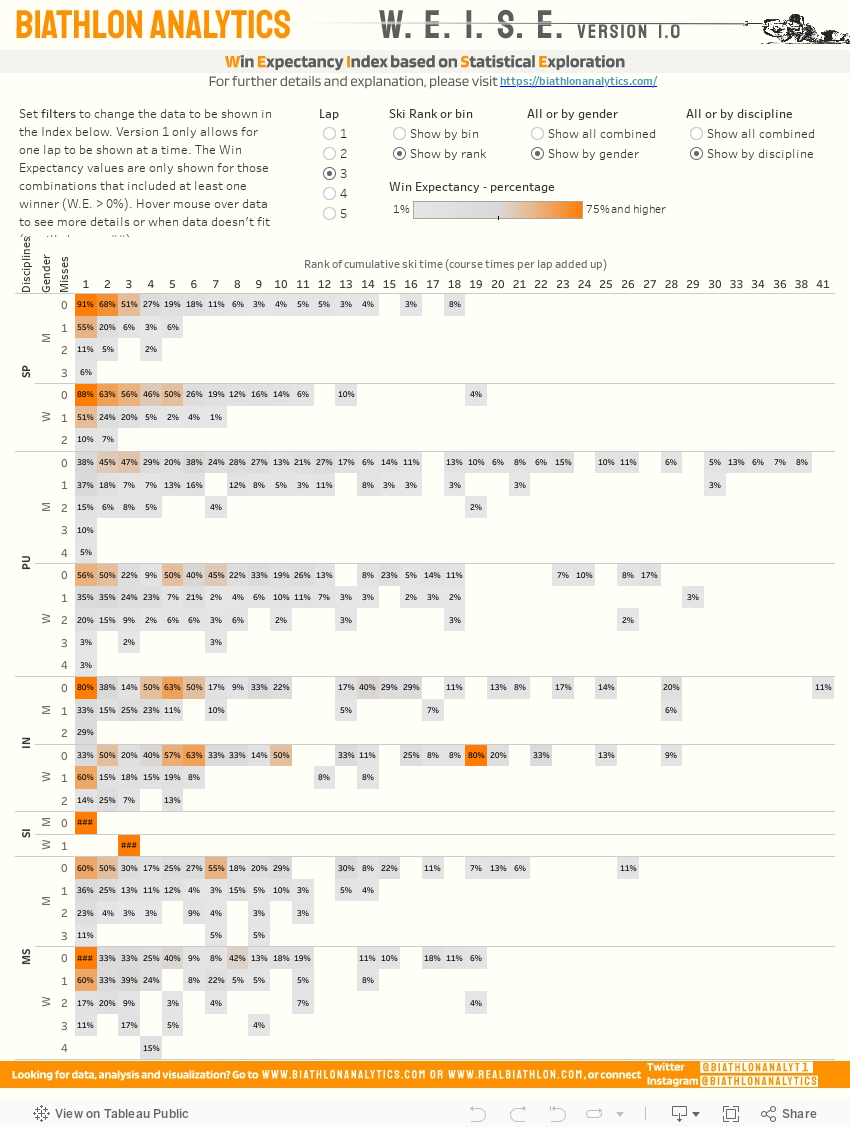
The W.E.I.S.E.
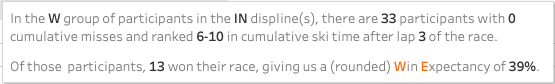
Now that I have introduced and described the creation of the W.E.I.S.E., let’s just have a look at it. Below is an interactive version of the Win Expectancy Index. Based on your input in the filters for Lap, Ski Rank or bin, Gender and Discipline, it shows the Win Expectancy for any combination of cumulative misses and cumulative-ski-time rank. If you hover your mouse over a data point it will show a pop-up with additional details, as shown below:
In case the embedded version below is not working or not displaying well on your screen, please go to the same dashboard on my Tableau Public site. If you’re not sure how to use the filters and such please see my previous post with some tips and tricks on how to use Tableau dashboards.
Applications of the W.E.I.S.E.
Examples
Now that you have a better understanding of the W.E.I.S.E. and an idea of what it looks like, the question arises: how does it add value? The following are examples of how I believe the W.E.I.S.E. can be used to better understand biathlon:
- See what combinations of misses and ski time rankings have the best WE for each lap
- Compare combinations for WE vs number of occurrences (probability vs reliability)
- Compare the WE to actual race results and see how they relate or why they differ
- See if the WE declines as ski time rank increases with the same number of misses
- Reversed, see if the WE declines as the number of misses decreases while the ski time rank (bin) stays the same
- For each lap in a race, analyze the changes in WE per athlete
- Look for commonalities when doing the above for a number of races for a specific athlete to identify potential weak spots or strengths
- Aggregate the WE per lap per race and compare races
- Analyze if multiple and/or big changes in WE in a race relate to interesting races to (re-)watch
- See if the aggregated WE can tell us anything on a nation’s level
- Once live becomes available from the IBU, it can be used to see live updates on Win Expectation for any athlete, and even (although it’s definitely not my thing) use it for betting during the race
- Change statistics to some that may better represent skiing and shooting
- Develop this further to show expected points per combination rather than just the expectancy to win.
Share your thoughts, please!
That’s quite a list of things that I can just come up with after giving it some thought. But let’s not stop there! If you made it through the article all the way to here, please let me know (Twitter) your thoughts about the application of the W.E.I.S.E. and your ideas on how to improve and expand it in the next version. If you’re not on Twitter, I’m also on Instagram and you can also email me (just add rj@ in front of my main website name). I would really appreciate your time and attention. I have plans to embed some of the ideas above in newer versions of W.E.I.S.E. in the following weeks, but new perspectives really help in improving it, so I’m looking forward to your feedback and the conversations!
RJ