
In the past season, and a few before that, there were a number of races where I was upset. And disappointed. And frustrated. And, perhaps, harsh. Emilien Jacquelin would have another day where he seemed to throw away an almost certain podium by shooting very, very, fast. Too fast, I’d think. Wasn’t it obvious? If he would just slow down a little bit.
I don’t have any issues with admitting when I’m wrong, and, being a data-nerd, I am curious if there’s evidence in the data that supports the theory that if only Emilien would slow down a bit, he would improve his chances of winning, or at least get a podium. I want to look at his shooting times, shooting accuracy, the combination of the two, the times of his first shot, potential influence of his position in the race, and his final shootings of a race. I’m hoping all this will give me, and you, the insight to answer the question: would Emilien benefit from shooting slower?
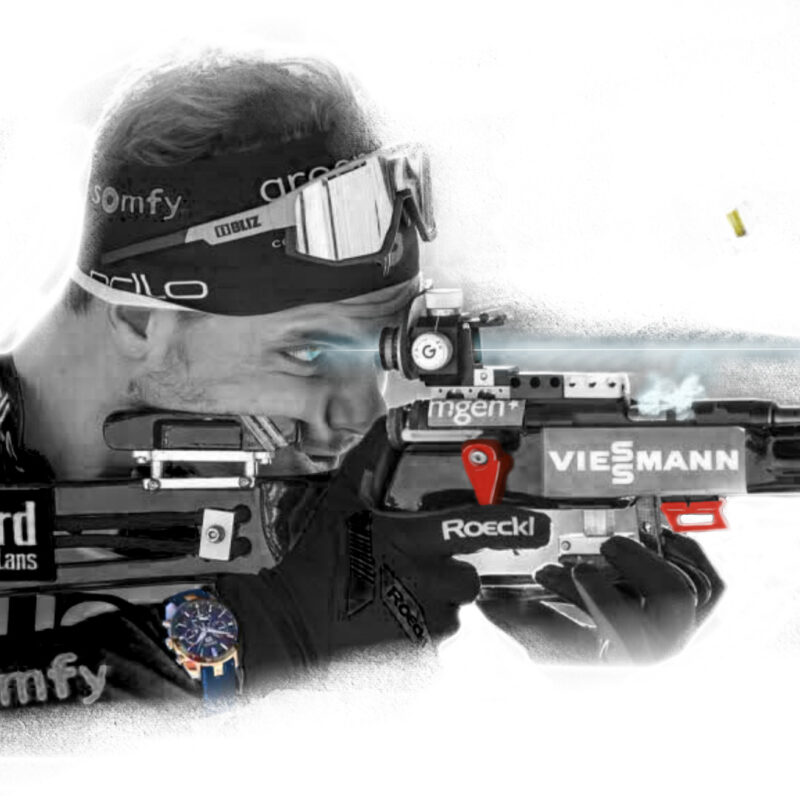
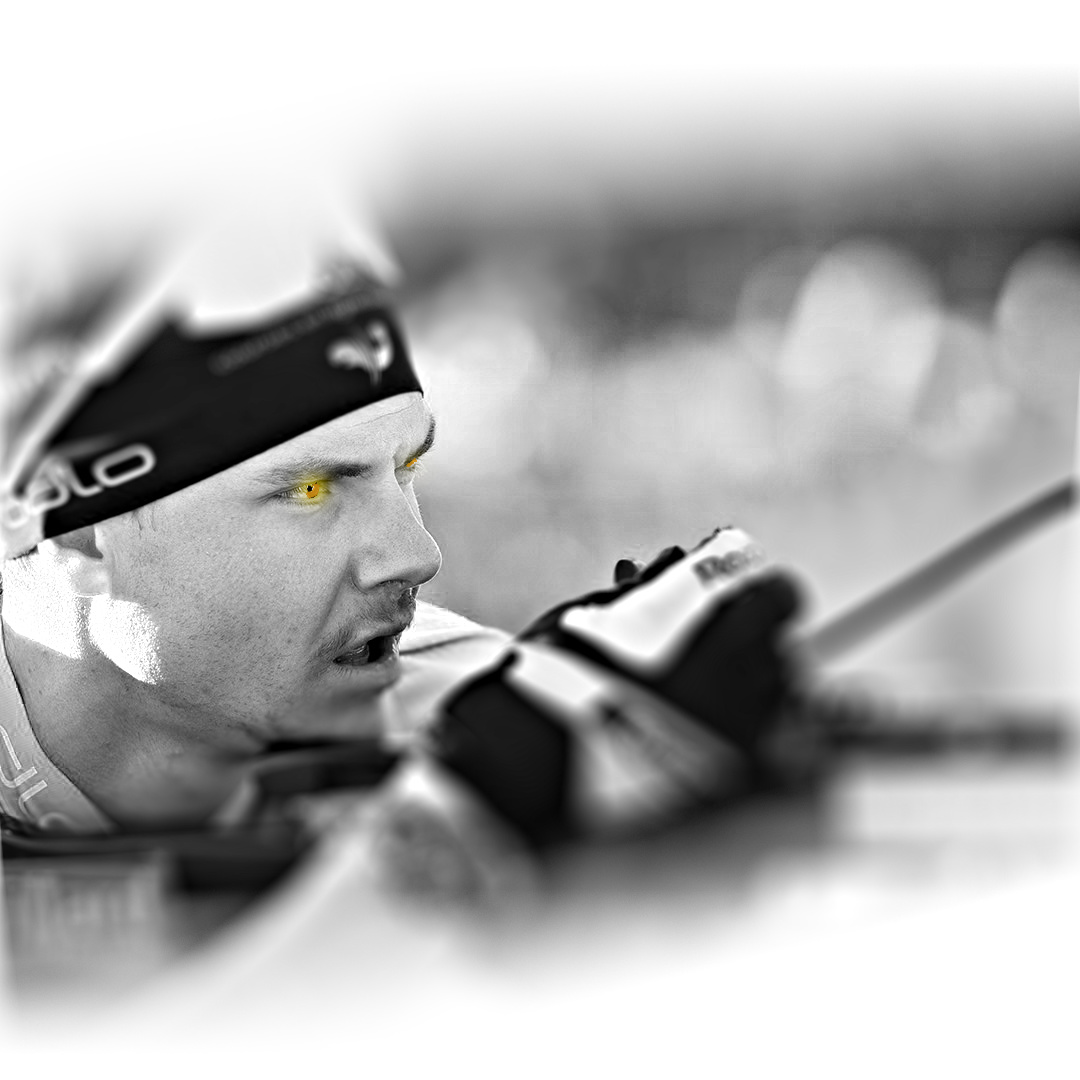
Emilien Jacquelin
I will admit I wasn’t a big fan of Emilien in the past years, mostly driven by seeing him giving up in a few races. But as I “got to know him” over the years, and perhaps better understand his reactions to situations, I have grown to like him. To the point that he’s one of my favourite athletes now. And on top of it all, he shoots in the same order as I do (right to left in prone, left to right in standing, although it seems he skips some shots sometimes to change things up). I can feel the connection!
He is, and always has been, exciting to watch, as you never know what he will try this time. He must make other athletes uneasy, when he rushes ahead in the first loop of a mass start. “Can he keep that up? What if he hits all five? He’ll be gone! What do I do? Follow, race my own race”. You get the point. Surprise is good. Unexpected is great. All or nothing attitude is super exciting!
It seems pretty obvious that if his fast shooting and speedy skiing tactics work in a race, it will be pretty impossible to keep him off the podium. But, unfortunately for Emilien, this will also result in some pretty bad results. It takes courage and confidence to pick up after a race where everything went horribly wrong, and be ready for the next race knowing that if everything clicks, he could be number one. This kind of rollercoaster approach must be pretty tough on him, and his fans. He has been quite open about going through some rough times mentally, and I know from personal experience how tough that can be. Biathlon is incredibly hard and unforgiving, and it punches you right on the nose when things go wrong. I can tell you that from personal experience too.
Data
For this analysis I looked at the non-team races of the last three seasons, with a focus on the past season (2023-2024). Non-results were removed, but World Cup, Olympic and Championship data are all included. Please note that although IBU’s data is of very high quality, a few data points are missing, causing some results to have odd looking values like only four shots in a shooting, or a 25% hit-rate for a shooting. I’ll try to explain when this happens.
In the past three seasons, Emilien raced 64 races, with 208 shootings (series of 5 individual shots) and 1,040 shots. This includes the 25 races, 84 shootings, and 420 shots from the 23-24 season. In this season, two shots from Emilien are missing in the data source: the third shooting of the pursuit on the first World Cup in Östersund, and the fourth shooting from the mass start on World Cup 7 in Oslo. I must admit I’m not positive about which shots didn’t record. Here are the two shootings with the unrecorded shots:
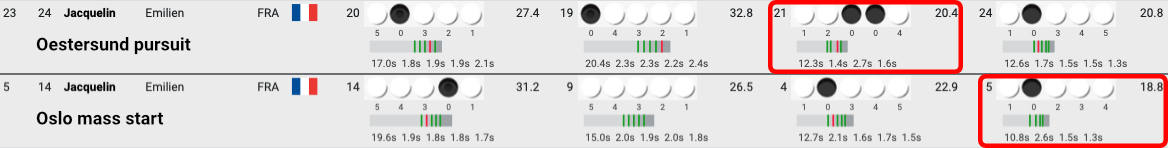
The IBU shot data is stored in a string of five characters. Numbers mean a hit; if there is a 1, then shot 1 was a hit. Based on the position of the 1 in the string, you can find which of the five targets was hit. Same for 2’s, 3’s, 4’s and 5’s. A zero means a miss. As far as I know the actual targets, from left to right, are referred to as alpha, bravo, charlie, delta and echo. This may be different on the other side of the Atlantic.
Based on this logic, combined with Emilien’s typical shooting order, we would conclude that in Östersund he shot alpha (1), bravo (2), probably missed charlie (0), then skipped to echo (4) and then went back to miss delta (0). That doesn’t seem likely. I’m guessing that as shot 3 or 4 was not registered, it also wasn’t counted, meaning the shot counter would still be at 3 or 4 after shot 3 or 4, and that means number 4 shown under target echo would be his fifth shot. And that he missed shots 3 and 4. Missing the whole target-box could be a reason that the shot wasn’t registered.
In Oslo it is likely he hit alpha, then missed the whole target-box on his second shot, and with the shot counter still on 1, he followed by hitting targets charlie, delta and echo. But even if I knew for sure that’s what happened, I am not able to add these records to the datasource manually.
Shooting fast
First things first: is he actually a fast shooter? Going through his IBU stats for the past season, he was fourth in shooting time average (including only athletes with at least 8 races), fifteenth in prone and fifth in standing. The chart below shows all the races of the last three seasons from left to right, and the seconds behind the field average shooting time on the vertical axis. Negative values indicate he was faster than the field average.
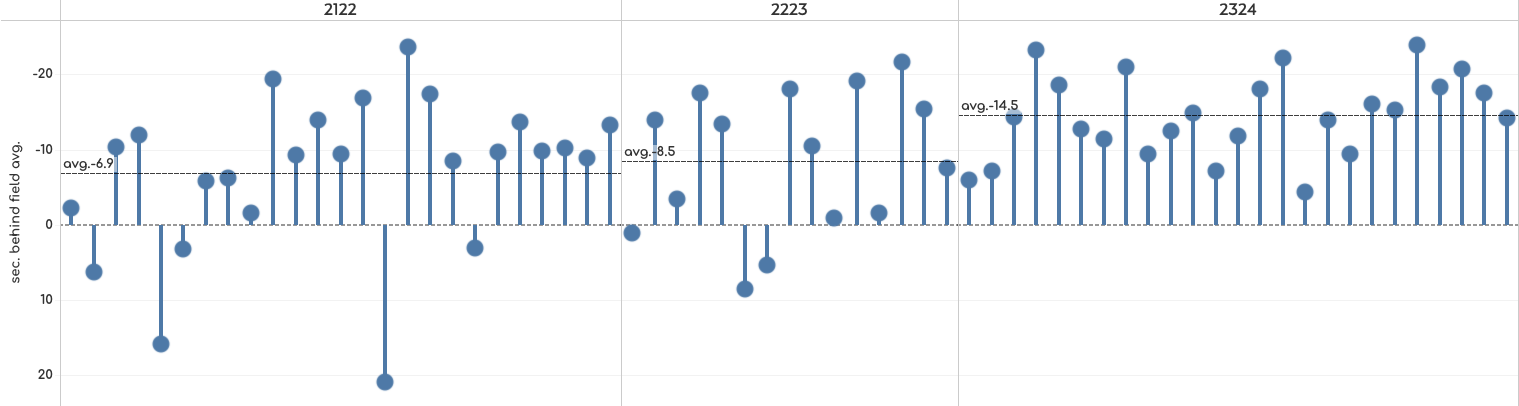
So yes, I would say if you gain between roughly 4 and 25 seconds on the field in any race during a season (23-24 in this case) just by shooting faster, you’re a fast shooter. His season averages for seconds back from the field average shooting time (black horizontal lines in charts above) were 6.9 seconds faster than the field average, 8.5 seconds faster and 14.5 seconds faster. And when comparing to the average shooting times of the top 30 athletes in the field, he was close three years ago (3.2 sec. slower), almost even in 22-23 (0.9 seconds slower) and faster last season by 5.8 seconds.
Z-scores
As explained in more detail in my previous article, The ultimate review of the biathlon season for wax-amateurs. Z-scores are a way to compare an athlete’s race performance in some measure, say shooting time, to the other athletes in that race, and it does so in a normalized way. As not every race is the same (different shooting order, number of shootings, etc.), simply put normalization allows for comparing pears to watermelons, kiwis and passion fruits (enough with those apples and oranges). It compares an athlete’s performance to either the whole field’s average, or the athlete’s season average, for example. These averages are represented by a zero line in charts. Higher than zero means slower/worse than the field, negative values are faster/better than the field.
Z-scores are expressed in number of standard deviations from the field’s average, which takes the variation or spread of all datapoints into account. For a ballpark number let’s say anything lower than -1.5 standard deviation is really good. Anything higher than +1.5 means you’ve got some work to do. Emilien’s season average Z-scores for shooting times compared to the field average were -0.6 in 21-22, -0.7 in 22-23, and -1.3 in 23-24.
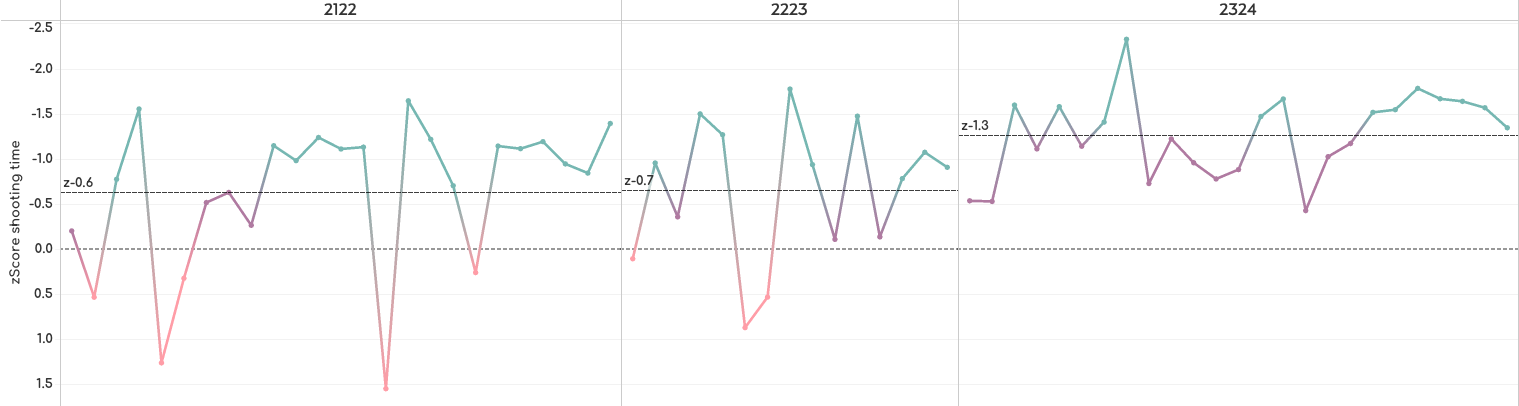
Based on his shooting time Z-scores per race we can say his shooting has gotten faster in the last three year, compared to that of the field.
However, so far we have looked at the shooting times of one or two prone and one or two standing shooting combined per race. But shooting prone or standing is a world of difference. Now isn’t it nice we can use the normalized Z-scores to evaluate prone and standing in the same chart?
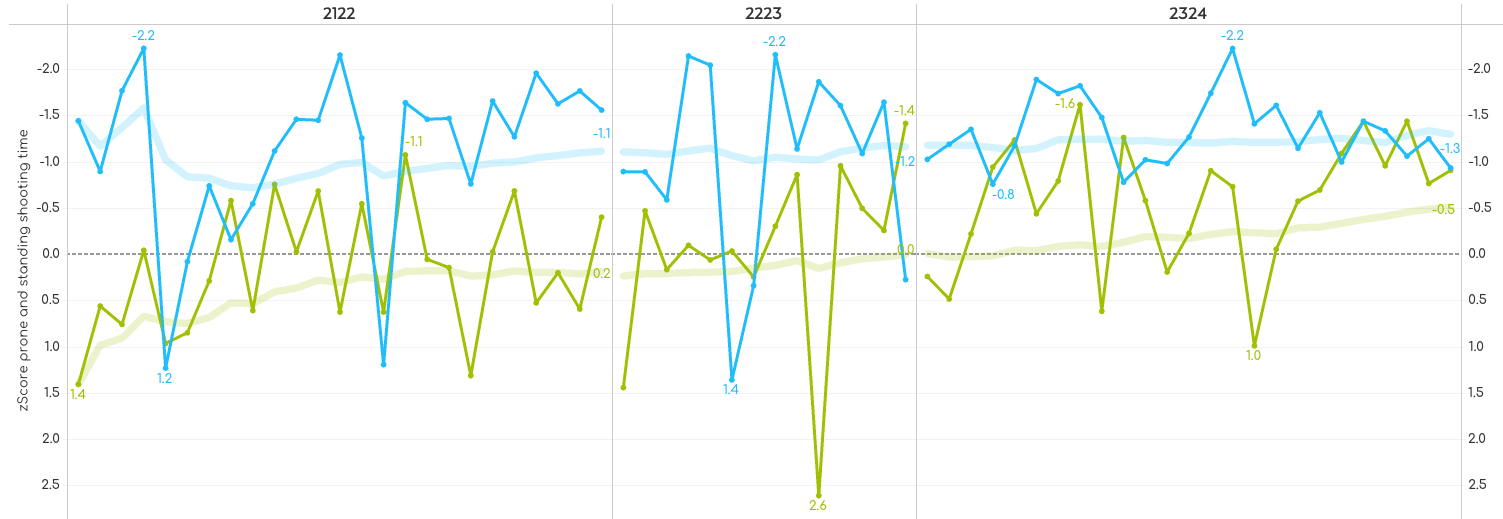
The thicker semi-transparent lines are the moving averages of prone and standing and this chart tells me a number of things: his standing shooting time has always been a great strength and has been fairly stable, especially in last season. His prone was not as good but has improved over the past three seasons and is now also faster than average. But it has more ups and downs than his standing.
First shot time
Shooting fast in itself will have an impact on shooting accuracy. But it also gives you less time to recover from the skiing, especially if the time between getting to your shooting lane and taking your first shot is very short. This is where you often see athletes still have a heart rate over 160 which only slowly drops during the next four shots. The chart below shows Emilien’s Z-scores for the shot time of the first shot of each shooting. Overall we can clearly see he is an athlete who starts shooting very quickly after he gets to the shooting mat, especially for a standing shooting.
So far we learnt that indeed he is a fast shooter, and that his first shot in standing is particularly fast. The last thing I want to check is his shooting time in the final shootings of a race. So the second shooting in sprint races, and the fourth shooting in all the other disciplines. And these are all in standing position.
Final shooting speed
Already knowing he is fast especially in standing it should not come as a surprise to see he is also fast in the final shootings of a race. But in those final shootings he is particularly fast. An average Z-score of -1.3 over the whole season is impressive, and not once was he slower than the field’s average for the final shooting.
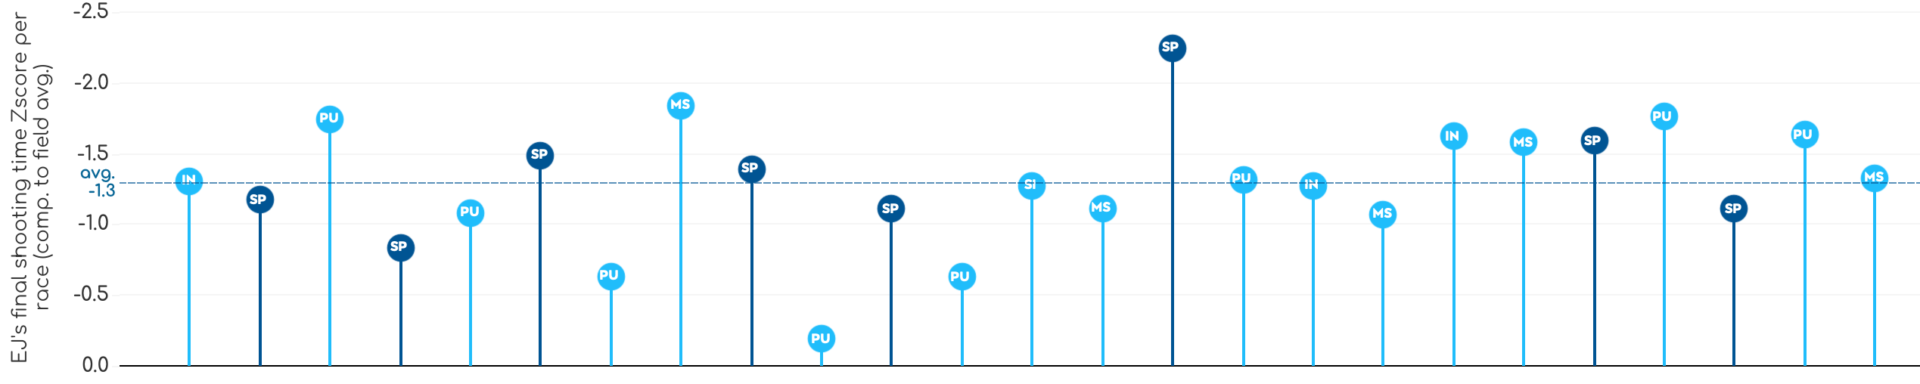
The chart also shows that he was very fast in final shootings of mass starts, in which only the best 30 athletes participate and all athletes start together. If your Z-scores are between -1 and -1.8 for those five races, you must be doing something right fast!
So, first conclusion: he is indeed a fast shooter, especially in the standing position and right after arriving in the shooting lane. Now I want to know if the targets he was shooting at so fast were actually falling over.
Shooting accurately
A quick look at the data of the last three seasons on Realbiathlon shows that Emilien is a good shooter, but not ranked among the best. Last season (23-24) he ranked 49th on the world cup (only including athletes with a minimum of eight races) in total and prone percentages, and 52nd in standing.
In the past season his shooting for both prone and standing improved overall compared to previous seasons, but was lacking concistency with many ups and downs throughout the season. I think the chart below showing actual shooting percentages demonstrate the advantage of using of Z-scores. The plain numbers without context don’t show me if the rest of the field was also shooting low percentages on days Emilien did. It could just be a bad day for shooting overall (lots of wind, poor visibility, etc.) or Emilien could have had a bad day personally while many others were shooting well.
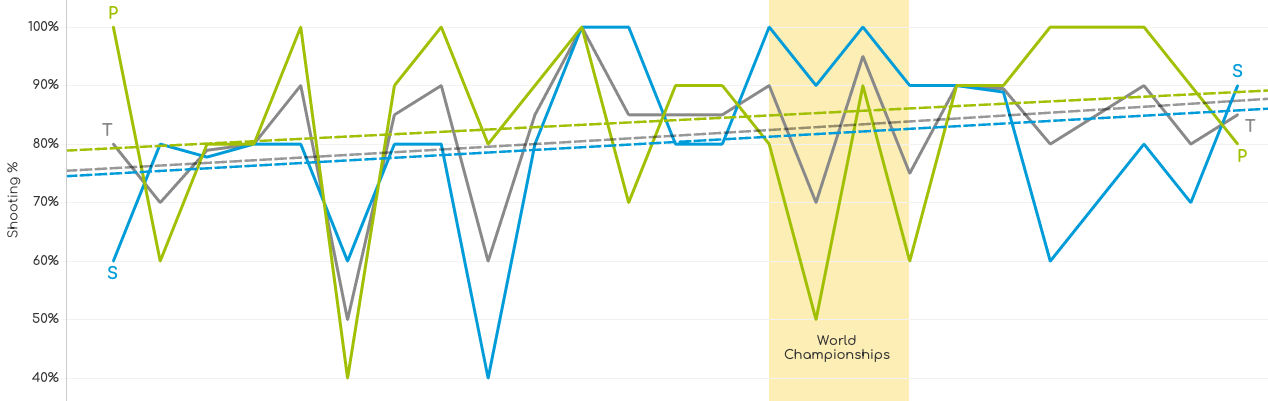
As the season progressed, Emilien’s overall shooting percentages increased for both prone and standing. Hopefully he can continue this trend in the upcoming season.
As shown for shooting times, looking at shooting percentages per races doesn’t give me much depth. Digging a little deeper into the shooting accuracy, the next four charts show each of the 1,038 shots from the last three seasons, as two are missing. Then, by aggregation per shooting position (prone or standing) I can see his hit rate per season, per shots 1 through 5 in a shooting, per shooting of 5 shots, and per individual per shot.
Starting with season averages, last season was a bit lower for prone after two very consistent seasons. Moreover, he has been declining in the last five seasons, after he shot around 90% in 19-20. In standing he broke the downward trend of the last two years. Given the fact he shot around 84% standing in 19-20 and 85% in 20-21, there’s no reason why he couldn’t increase his average above the 81.3% of the 23-24 season.
The next chart shows each shot in a shooting. Please notice that in many cases there are a limited number of datapoints, especially in the 22-23 season, averages are not as reliable as I would like. Also remember that the two shots missing from the datasource were shot 2, and shot 3 or 4, both in standing.
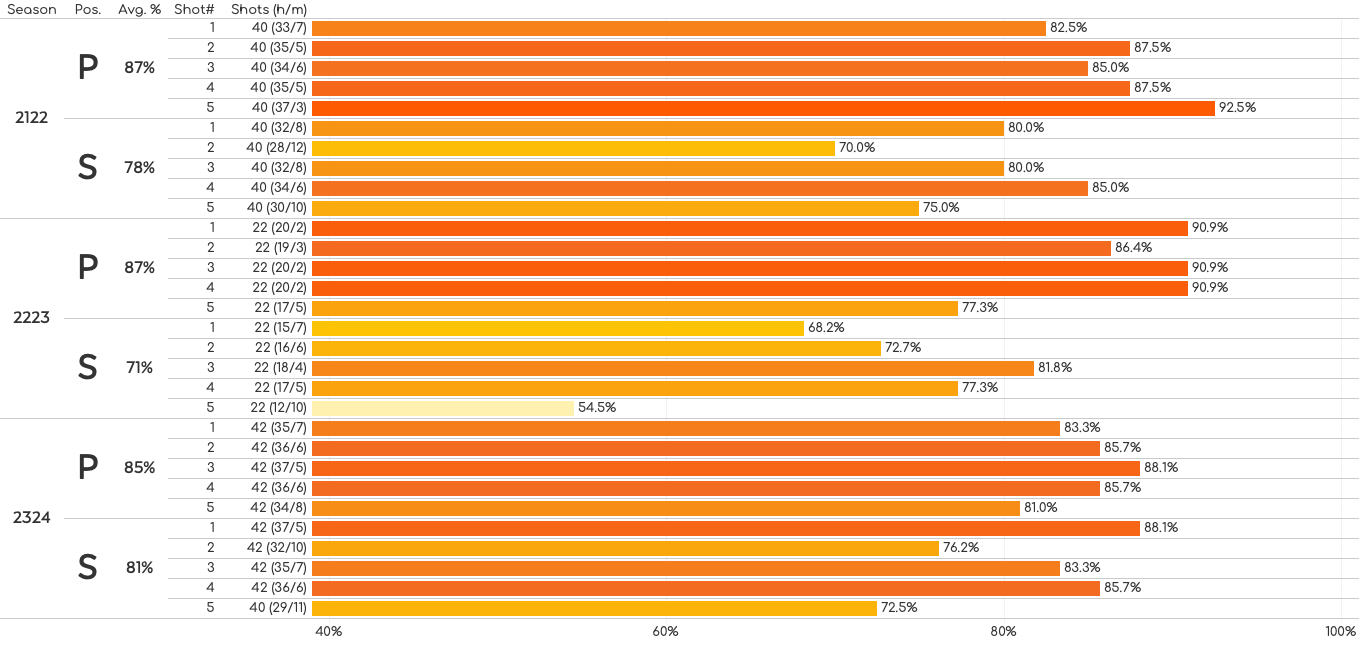
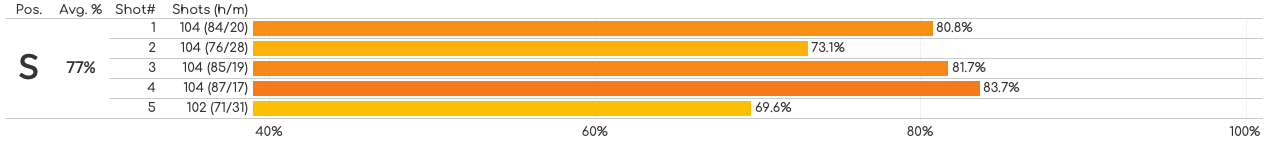
It is interesting to see, that for his standing shooting in 23-24 shot numbers 2 and 5 clearly had a lower hit rate. The same thing happened in 21-22, and in 22-23 it was shots 1 and 5. When I quickly combine the three seasons, this is even more obvious.
I’m going to keep this in mind for further analysis later on, as I first want to see his hit rate for each shooting (group of five shots).
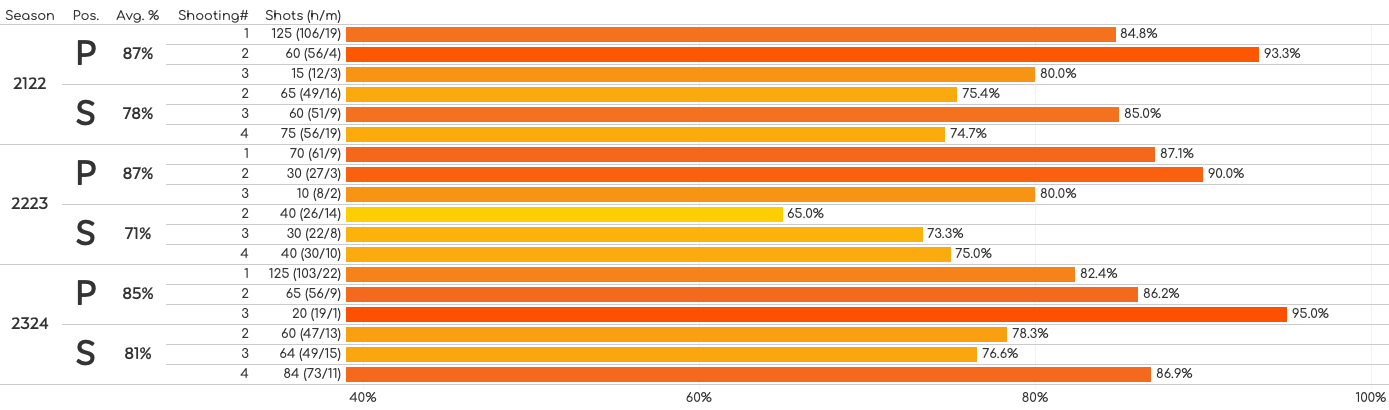
Emilien seems to better as the race progresses after the 21-22 season. He made a lot of improvement on his fourth shooting, which is always in standing position. In 22-23 he missed 10 out of only 40 shots, but in 23-24 he missed just one more shot but out of 84 shots. That is quite an improvement!
When I combine all his races form the three seasons, the data shows that in prone he shoots best in the second shooting (pursuits and mass starts), and in standing shooting his third and fourth shootings are very close. Knowing that sprint races finish with standing in the second shooting, his lower average (73.9%) could be concerning, as the sprint is the most raced discipline. He participated in 24 sprints in the last three seasons, and only nine individuals.
Finally I had a look at each individual shot per shooting, keeping in mind there is not a lot of data for each combination. For example, in the 23-24 season he shot 88% for his 5th shot of shooting 4 (standing). This average is based on only 16 shots of which he missed two. It’s the square in the “5”-column, about halfway down, just above the first black line in the matrix below.
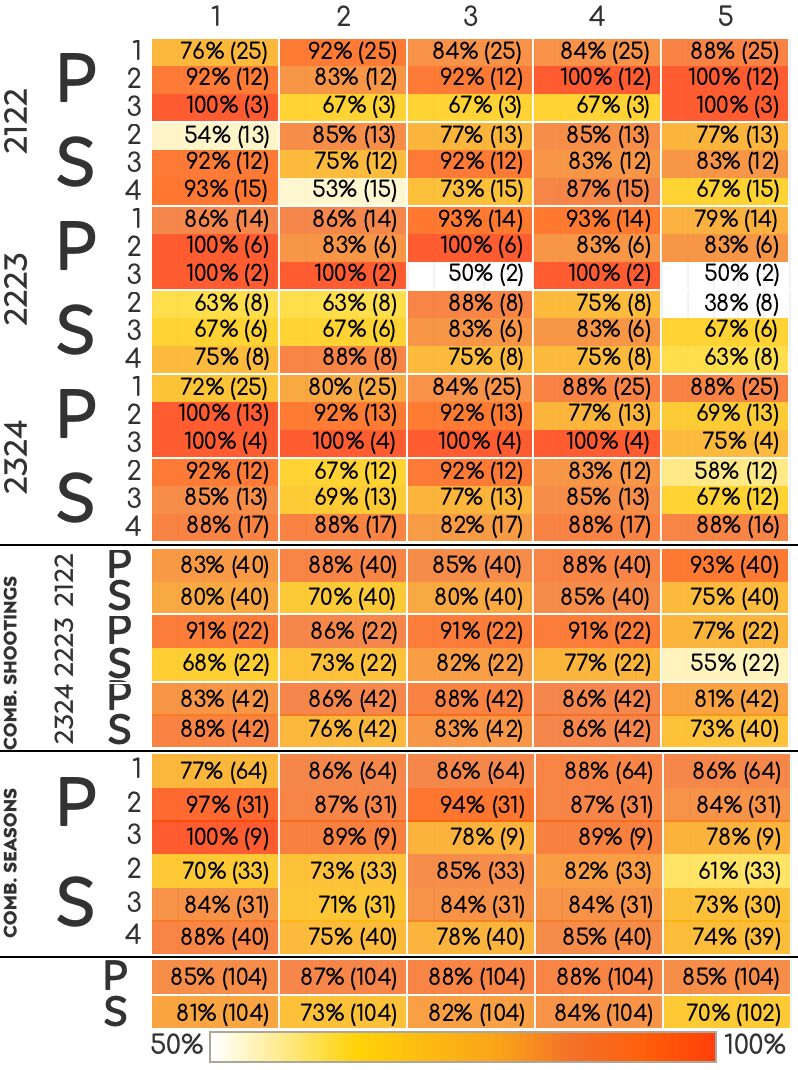
Knowing his second and fifth shots in standing overall have not been very good, it’s a bit of a surprise to see those shots in the fourth shooting in the 23-24 season being as high as they are (both 88%). More on that later on.
First shot accuracy
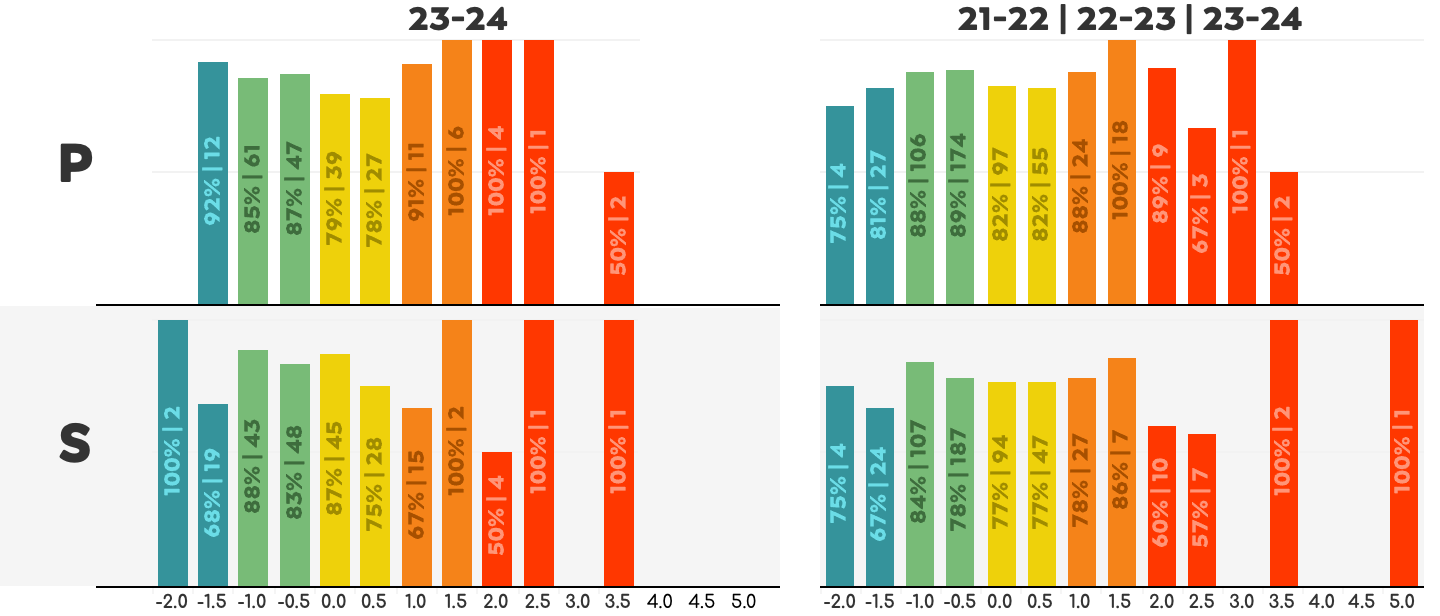
Since I looked at the shooting times of his first shots in particular, I will also look at his hit-rate of those shots. Since there are only 25 races with 84 shootings in 23-24, and thus 84 first shots, it’s pretty easy to see how he did for each shot how he did.
In prone he missed the one first shot that was very fast (-2<-1 category), but overall his first shot hit rate in prone is 83% with 7 misses out of 42 shots. Exactly half of the first shots were faster than the field average, and he actually shot better when faster (3 misses out of 21, 86%) then slower (4 out of 21, 81%) than the field.
Of the 42 first shots in standing position he missed only 5 (88%), and of the 12 first shots that were in the Z-score category -2<-1 he hit 92%. Of all first shots slower than the field he hit 20 out of 25, 80%.
Despite the low number of data points, this still gives me an indication that shooting slower doesn’t necessarily improve his hit rate.
Final shooting accuracy
The last thing I want to explore is the final shooting, which is always in standing position. In the 23-24 season he basically had 5 final shootings to forget, 10 good ones and 10 perfect ones.
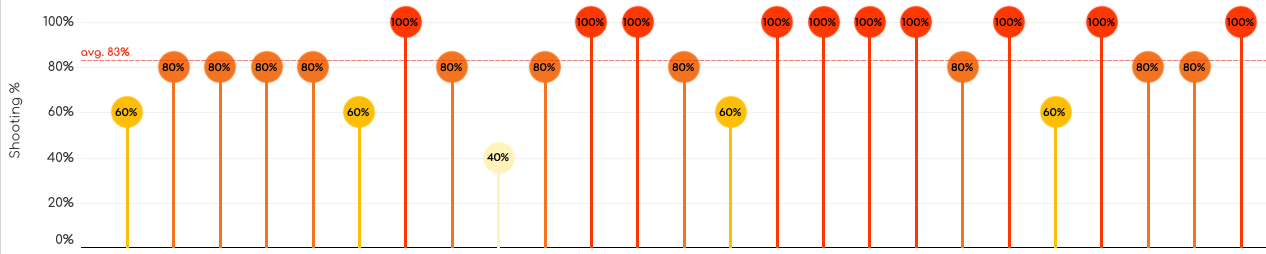
I think it will be hard to find another athlete who would not be happy with final shootings like that. And even shooting 60% is not immediately putting you out of contention, as he proved in the Soldier Hollow sprint where he finished 2nd, only 3.9 seconds back from the winner.
Shooting fast & accurate
Shooting fast is great, but it won’t do you any good if most of those shots miss the target. Shooting clean is great, but if you take around 25 seconds longer or even more, it’s not a guarantee for a top result. So in this section I’m combining the information from the previous two sections: shooting fast and shooting accurately. And hopefully this will give me a better idea if slowing down a bit in the range would have the potential to benefit Emilien in the results list.
Race-level
When comparing the Z-scores for shooting time (vertical axis in chart below) and shooting accuracy (horizontal axis) for each race of the last three seasons, I can categorize each race in some basic categories: if Emilien shot slower than the field average and had a lower hit rate than the field, I categorize that race as bad. Faster and lower hit rate is fast, slower and better is accurate, and faster and better is super. Perhaps not the best terms to use, but you get my point.
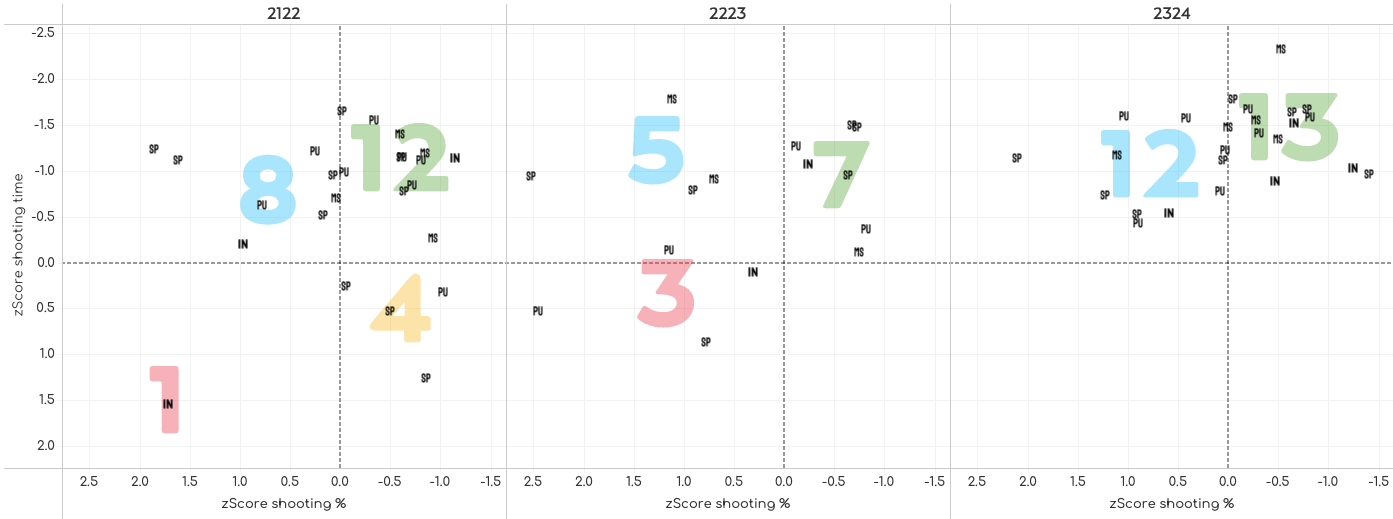
In exactly half of the 64 races in the last three seasons he had super races shooting faster and better than the field average. Last season he had 13 super races out of 25. And the other 12 were fast races where he was still faster, but his hit rate was lower than the field average.
In the last three seasons he went from 1 to 3 to zero bad races in which he shot slower and worse than the field, which highlights that the 22-23 season was not his year. And after having 4 accurate races in 21-22 where he shot better but slower than the field it did not happen again since then. The number of fast races increased from about a third in 21-22 and 22-23 to almost half of the races in 23-24. And the percentage of races where he shot better than the field average went from 64% in 21-22 to 47% in 22-23 and 48% in 23-24.
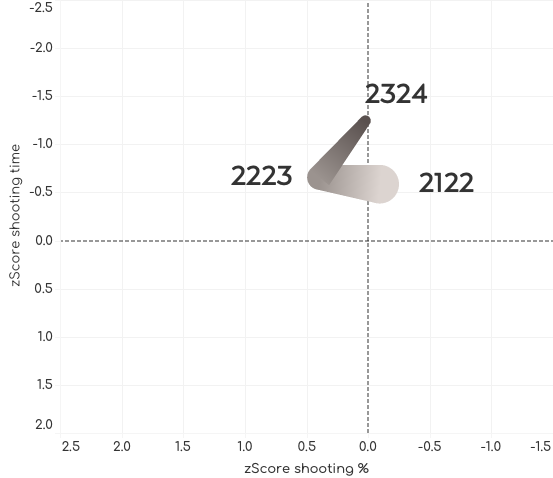
Based on his season averages and the general idea of 22-23 being an off year there is a bit of a shift noticeable. He has been shooting quite a bit faster with a small reduction in hit rate, compared to the field. Does this give me the first indication that the increase in shooting speed had a negative impact on his shooting accuracy?
Shot-level
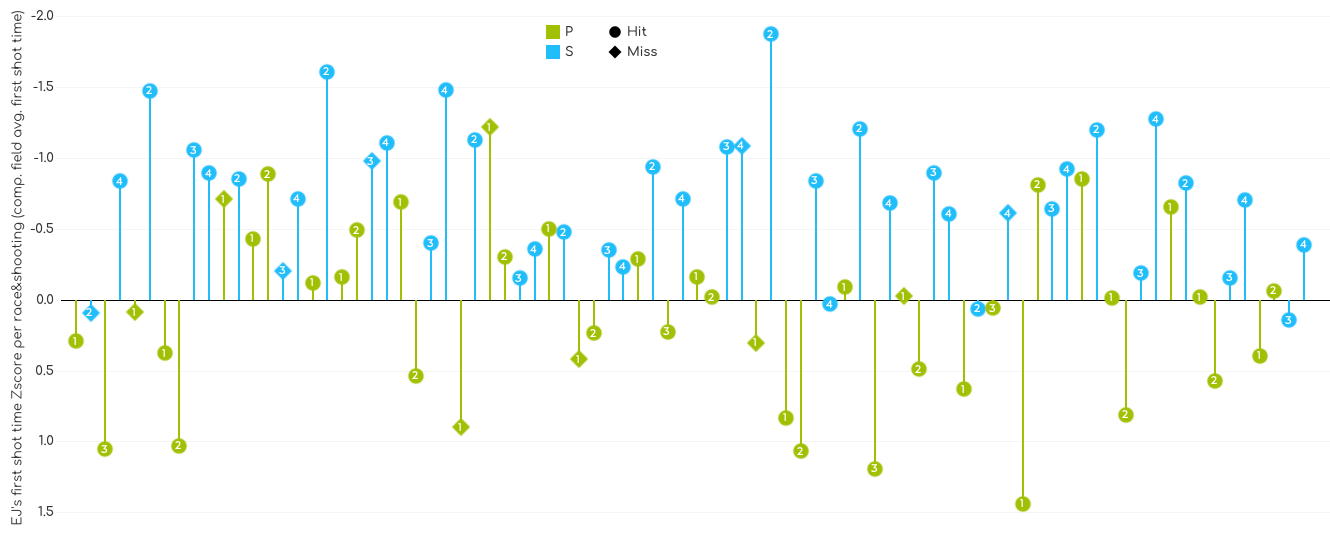
Knowing Emilien’s season averages for shooting time per each shot 1 through 5, I can compare every individual 1st, 2nd, 3rd, 4th and 5th shot of the season to these averages. And based on that I can show for each individual shot if it was fast or slow compared to his own standards. So here I’m not comparing the field average, but his own season averages. And keep in mind that shooting slower than your average is much easier and has a lot more room than shooting faster.
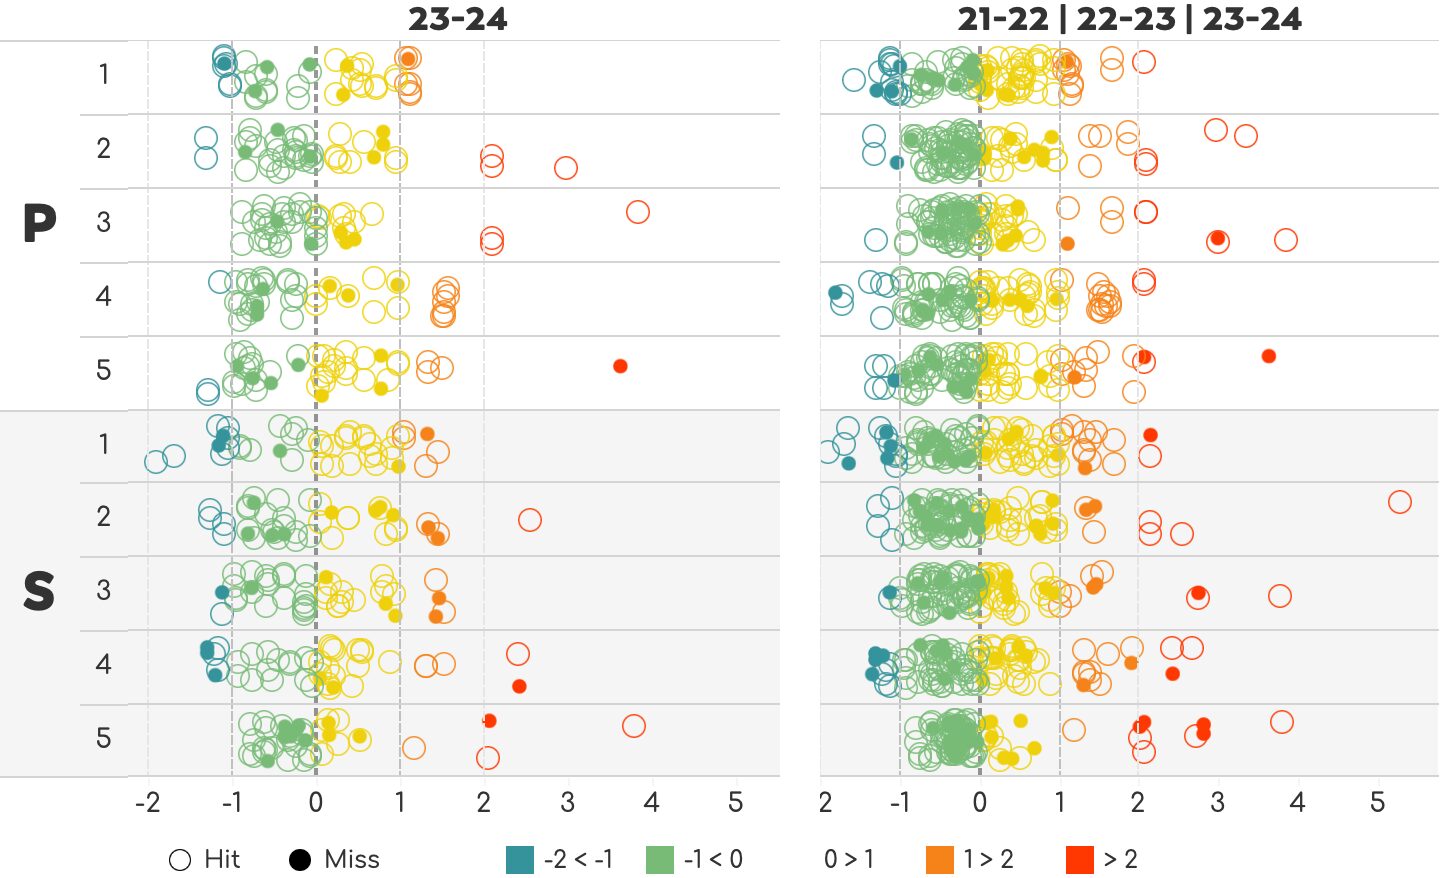
Every shot he took in the 23-24 season is in the left part of the chart above, and all shots in the past three seasons are combined on the right side. As expected, the majority of the shots are around the season average (Z-score = 0), represented by the green and yellow circles (hits) and dots (misses). But we also see a good number of outliers, on both sides (blue and red). As mentioned earlier, the slower outliers on the right side of the charts are further out, than the faster ones on the left.
What stands out to me is the fact that none of the standing shots in the shot 5 group have a lower Z-score than -1, which suggests that he doesn’t rush his final shot in a shooting. And just eyeballing it, he doesn’t appear to be missing more on the left side of 0 than on the right side, which could indicate shooting faster does not mean his hit rate will be lower. But what good does eyeballing do if we have all the data?
After I aggregated the data I put each individual shot in the applicable “Z-score bucket”, and then calculated the hit rate for each bucket. The labels not only show this hit rate for each bucket, but also the number of shots inside of this bucket. This will help understanding how reliable or useful each bucket value is. The bucket for standing shots with a shot time Z-score of -2 or faster has a 100% hit rate but this is based on only 2 shots. Which is great, but not very representative nor reliable for any predictions or specific analysis.
Although it gives us some information, with some many columns only having only a few shots I aggregated the data a bit more. While the buckets are still based on few shots in some cases, there is enough data to give me a sense of what’s happening when he shoots fast.
In the 23-24 season, shooting faster than his season average was great in prone. He hit 104 of 120 shots (108+12), hit rate of 87% for those two categories combined. In stand however, there was a drop in hit rate when he shot really fast. Interestingly though, his slower shots also had a lower hit rate.
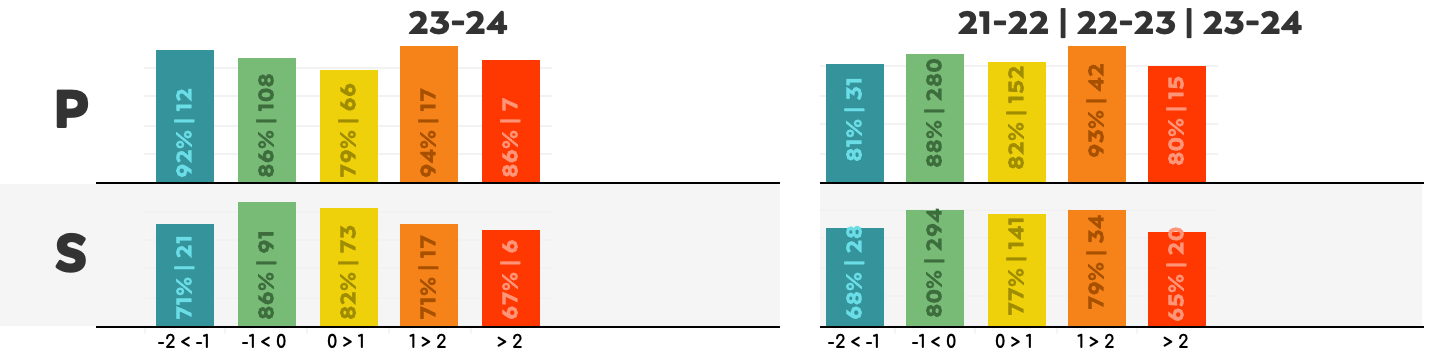
The second part of the chart above is based on the last three seasons combined, and shows a similar drop-off for standing on both ends. Prone is more consistent, yet still the fastest and slowest have the lowest hit rates.
I have yet to be convinced slowing down would help Emilien get better results. It could, but it’s not obvious from the data so far that it would for sure.
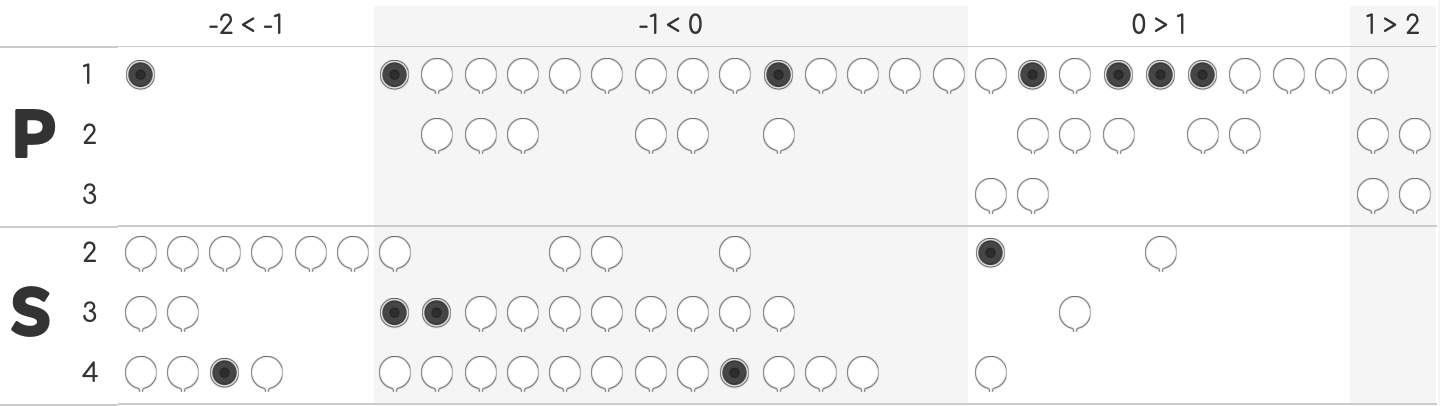
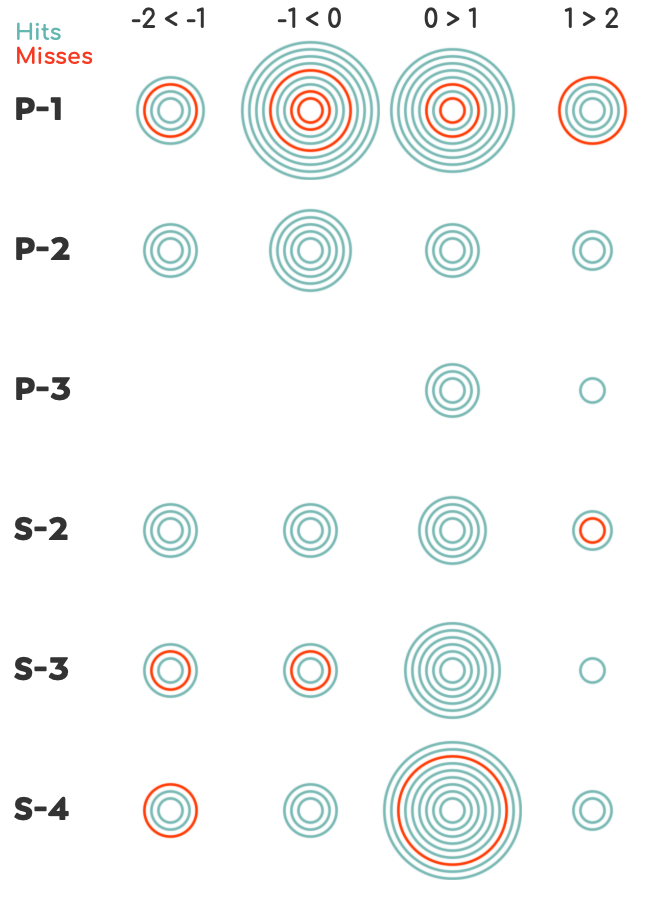
First shot
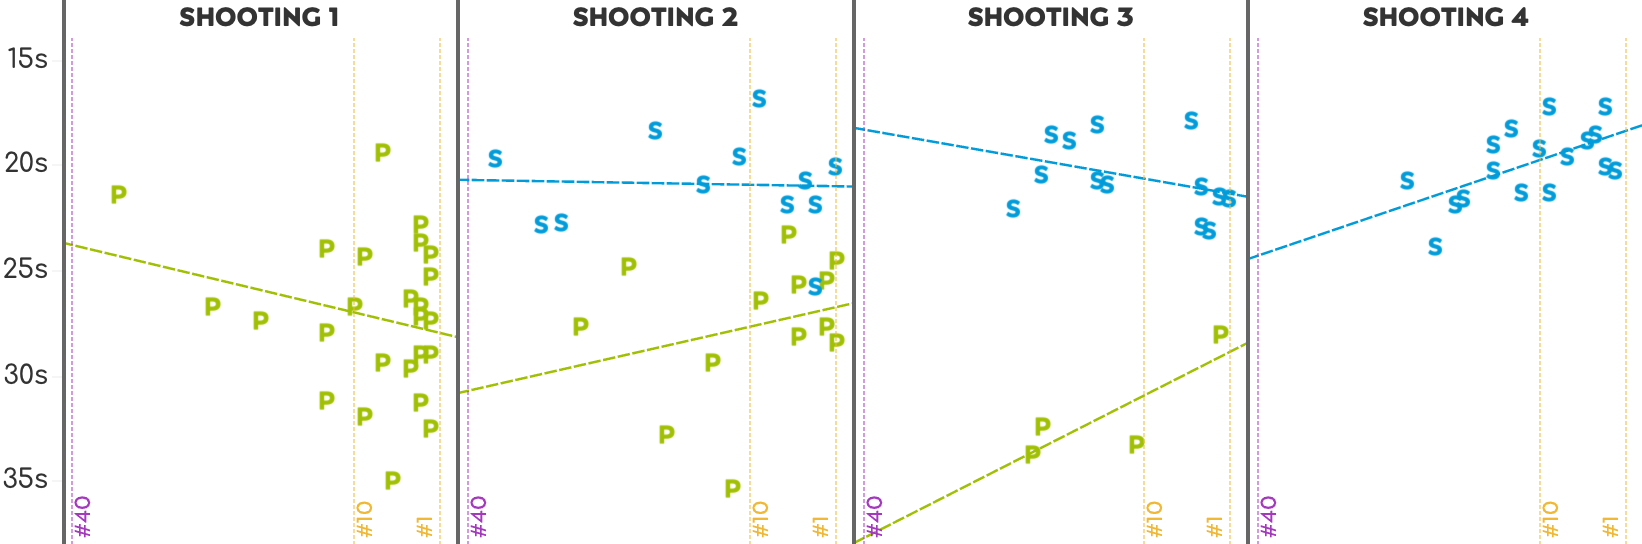
Every first shot of the 23-24 season is represented by one ring in the appropriate Z-score category for shot time compared to his own average, per shooting. In the first prone shooting, which is also the first shot of each race, the majority of his shots are around his shot time average. In the third standing shooting, one could argue that shooting slower could increase accuracy, as he missed 2 of the 6 faster than average shots. But with so few datapoints I’d be reluctant to draw conclusions. The first shot of the fourth shooting, always in standing, is generally a bit slower than average, and when he does shot fast, he missed 1 out of 3.
Final shooting
For the final shootings I took a different look at the data. The final shooting of each of the 25 races of the 23-24 season is shown below in a 5×5 matrix. The first race of the season is top left, the last one bottom right. There’s a lot of information in this chart so I’m going to take a bit more time to explain.
- There is one race (light green text) in each of the 25 “cells”, showing the five shot results of the final shooting in each race from left to right by shooting order.
- White target cover icons represent hits, black target icons show misses.
- On the vertical axis you see the shot time Z-score for each shot compared to Emilien’s own season average (shown as a blue dashed line on the Z-score value of 0). Last reminder: negative values are faster than average.
- The thinner red dashed line, shows Emilien’s Z-score for the final shooting time compared to the field average.
- And for those of you who are still not satisfied with all this waterfall of information, I added the field’s average hit rate as well (light blue).
So, taking the first race, the individual in Östersund: he shot hit-hit-miss-miss-hit and all five shots were slower than his own season average. However, he shot faster than the field did as I can tell from his -1.3 Z-score in red, but the field shot 22.5% better (82.5% compared to 3/5, 60%).
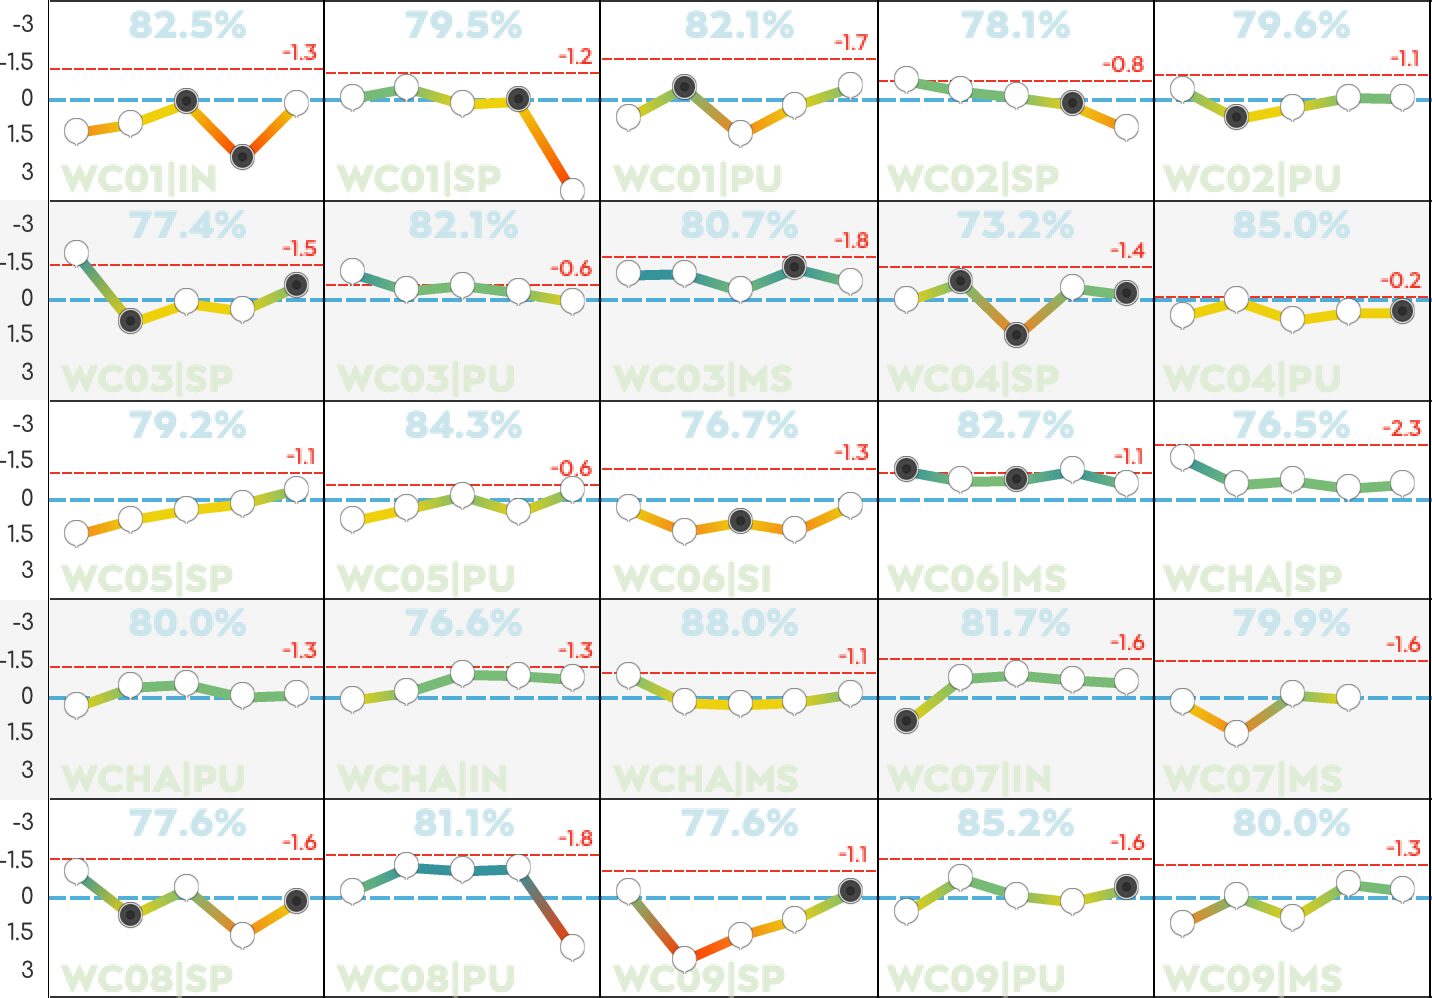
In general it is clear that if he shoots fairly consistent shot times and nothing too far from his season average, the results are very good. I see 16 examples of those in the 25 races, including 8 where he shot clean. Except one race with two misses, he had one miss in the 7 other. Of those his 80% was better than the field average.
Emilien had three final shooting where all his shots were slower than his average, and he missed 4 of those 15 shots. On the 5 shootings where every shot was faster than his average, he 4 misses out of 25. You do the math. Shooting slower is no guarantee increased likelihood of better shooting. Shooting consistent around his season average is.
For a moment I thought to see a trend in the first four races, as the shot after a first miss was quite a bit slower than the other four shots. But this “trend” stops after the fourth race. Did he make an adjustment, or is this just a matter of only having a few datapoints?
Pressure
The last thing I want to look into is if and how pressure affects his shooting. The final shooting is the last time where an athlete can maintain or give up his lead, catch up with the leaders or even take over top spot. Success or “failure” is determined in this shooting in less than 25 seconds. I just want to look at Emilien’s data for this section, so I’m going to work with the raw data here. His final shootings, in standing position, are compared to the previous standing shooting in the same race. Sprints therefore are not included as there is only one standing shooting, and it doesn’t make much sense comparing prone to standing shooting.
I did this per race for the last three seasons, and then aggregated the data on the seasonal level. The chart below shows the absolute difference between the first standing shooting and final standing shooting per race, for shooting time (vertical) and shooting percentage (horizontal).
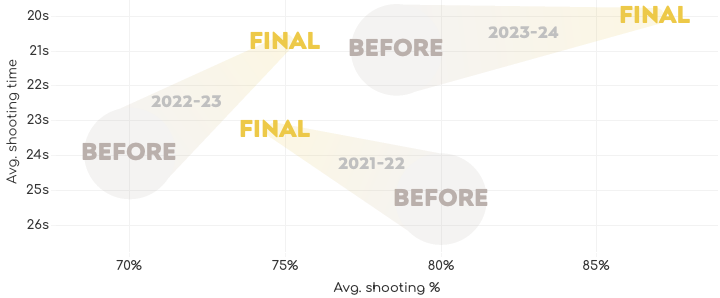
In the 21-22 season his final shooting had a lower shooting % and faster shooting time than his earlier standing shooting. In 22-23 he not only shot faster, but also better, followed by the 23-24 season in which his shooting was just a fraction quicker (but he set the baseline a lot higher already) and his hit-rate was significantly better. And yes, I know there are not a lot of data points here. But I wanted to dig deep so I’m leaving no stone unturned.
So has he figured out a way to shoot better and faster at the moment it typically matters most?
High rank means pressure means faster shooting means lower %
I can safely assume that when entering the final shooting in 27th position, three minutes behind the leaders, the pressure to shoot clean is a bit different than when entering in (or close to) the lead. Thinking of Emilien in the first scenario, it’s not unlikely to picture him trying to rattle down the targets in 12 seconds, just because he can, and, well, because he is Emilien Jacquelin. But for the second scenario, with the win at stake, some people are more sensitive to pressure than others. And based on what I have seen in the broadcasts, I am not sure at all if Emilien falls in the “cold-as-ice” category, or the “easily looses his cool” category. We have seen races where everything clicked and he looked as cool as a cucumber, but others where his face looked like an exploding deflated watermelon (really, what’s with all this fruit?).
To have a bit more foundation from the data around this high-rank-leads-to-pressure-idea I took a look at his race position when entering the range before each shooting and then looked at his shooting time.
The trend-lines for 23-24, although based on a limited number of datapoints, draw an interesting picture: both the second and third shooting in prone as well as the fourth shooting in standing have an upward trend, where the other are downward or flat. The upward trend-lines include the final shootings of races with four shootings (all standing), and the last prone shooting in other races. This suggests that added pressure from being in a strong position in the race, Emilien tends to shoot faster. Does this have an impact on is hit rate?
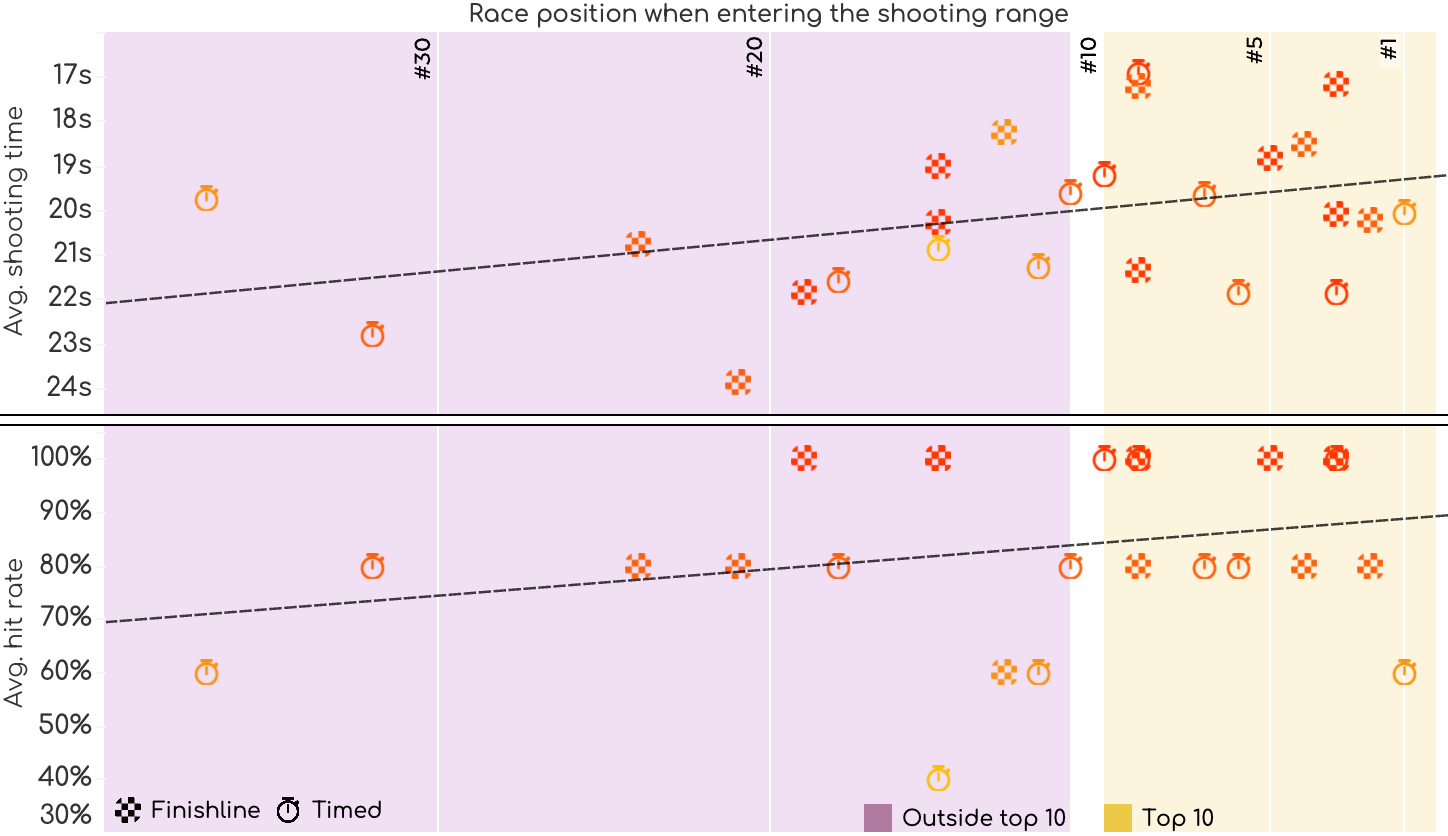
Generally speaking, both Emilien’s shooting time and hit rate improve when he is closer to the lead when entering the range for the final shooting of a race. Based on the charts above, he just needs to make sure he is in third position at that time, as he shot 100% on each of the three occasions last season. Coming in first only happened once, and he shot 60%.
The last chart of this section splits the final shootings of races that are timed (sprint and individual) from the ones that are won by crossing the finish line first (pursuit and mass start). For both groups it then compares races where he entered the final shooting in a top 10 position to those where he was outside the top 10. Last season he shot better and faster when entering in a top 10 position for either race type. So again we see no evidence in the data that shows shooting slower will increase hit rate success.
Conclusions
I’m going to keep this short and simple: I owe Emilien Jacquelin an apology. An apology for every time I yelled “take your time!”, “slow down”, “you’re throwing it away”, or discussed on the podcast what he should and shouldn’t do. He knows what to do. And I think he likes the pressure. And nothing in the data shows that he should change anything from the shooting the way he is (with a few minor adjustments perhaps):
shooting for nothing but gold
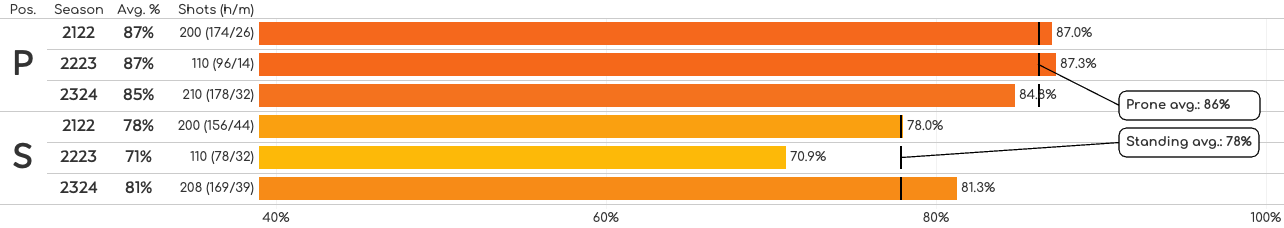
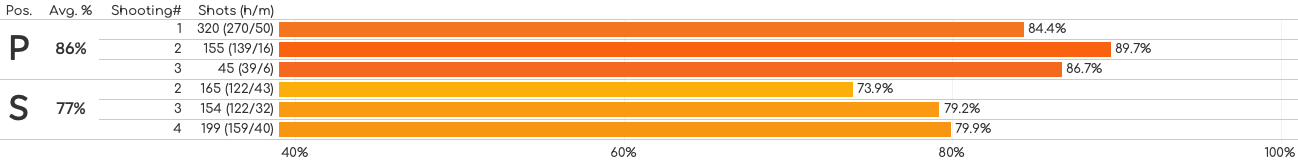
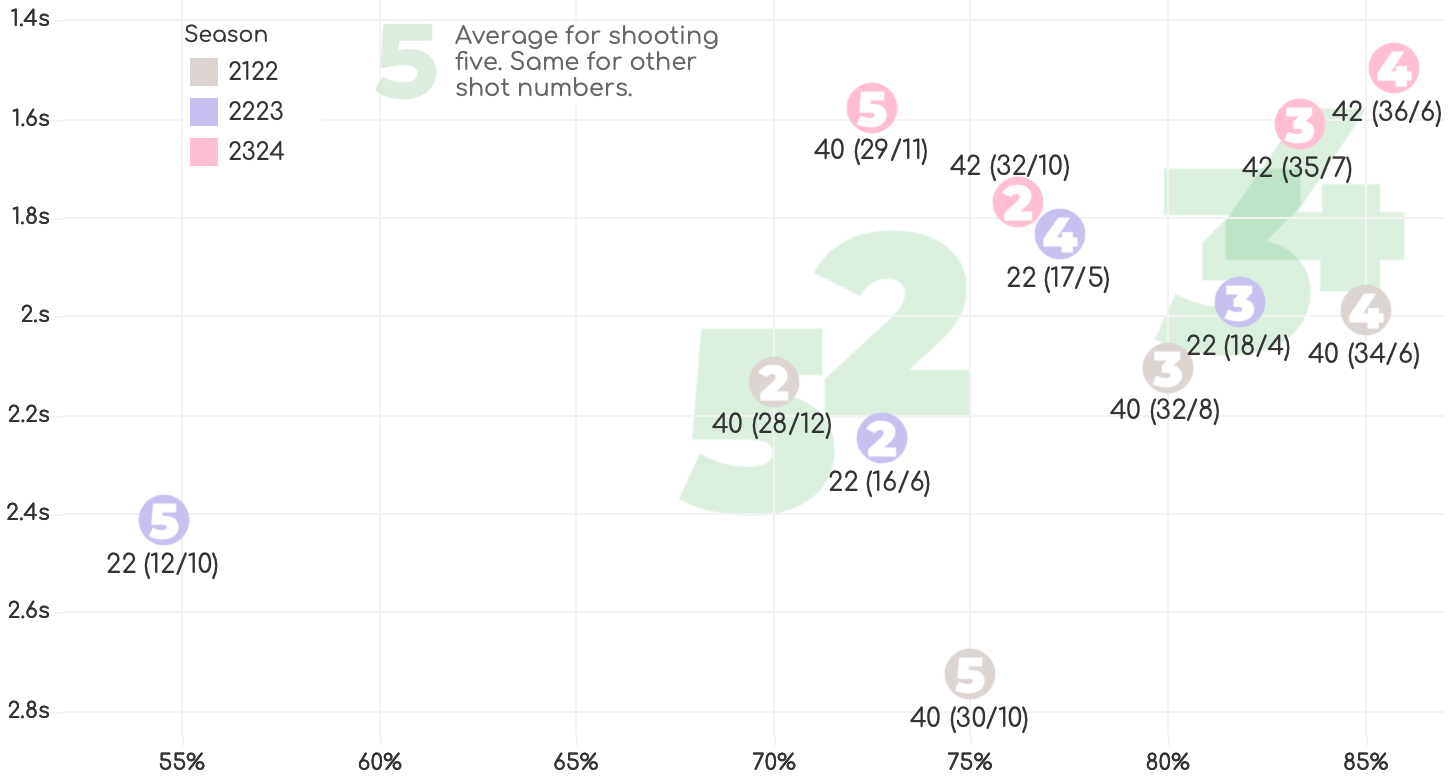
Oh, about those shots 2 & 5. In the chart below are all the standing shots two, three, four and five from the last three seasons, grouped by shot number and season (I have left out the first shots as they are a bit different than the others). The shots’ positions are based on the average shot time and hit rate. The annotation shows the number of “shots (hits/misses)“. Shots two and five are his weakest shots but last season he had them much closer to shots three and four. Perhaps he recognized this weakness himself and fixed the problem before the 23-24 season?
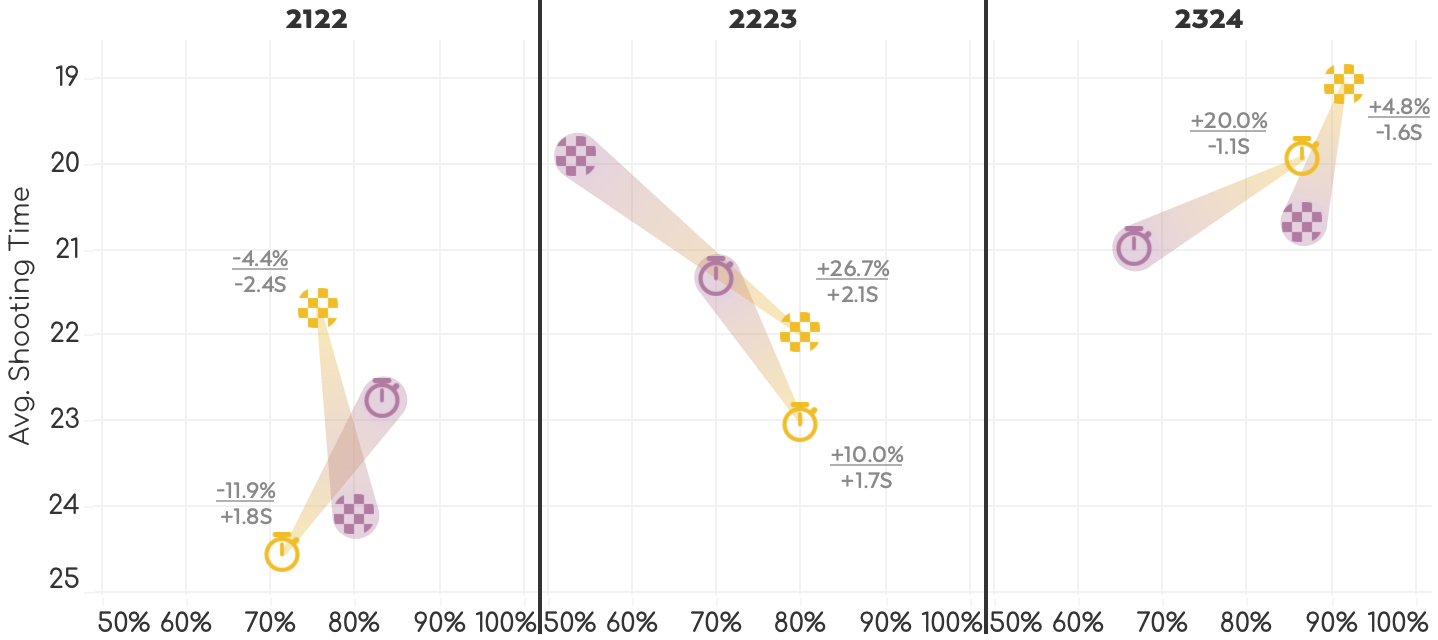
For the very last chart I’m diving a little deeper once more. For each season I compared the standing shots two and five in the final shootings of the race to three other groups of shots: the other shots two and five in the non-final shootings, the shots three and four in the final shootings, and the remaining shots three and four in the non-final shootings.
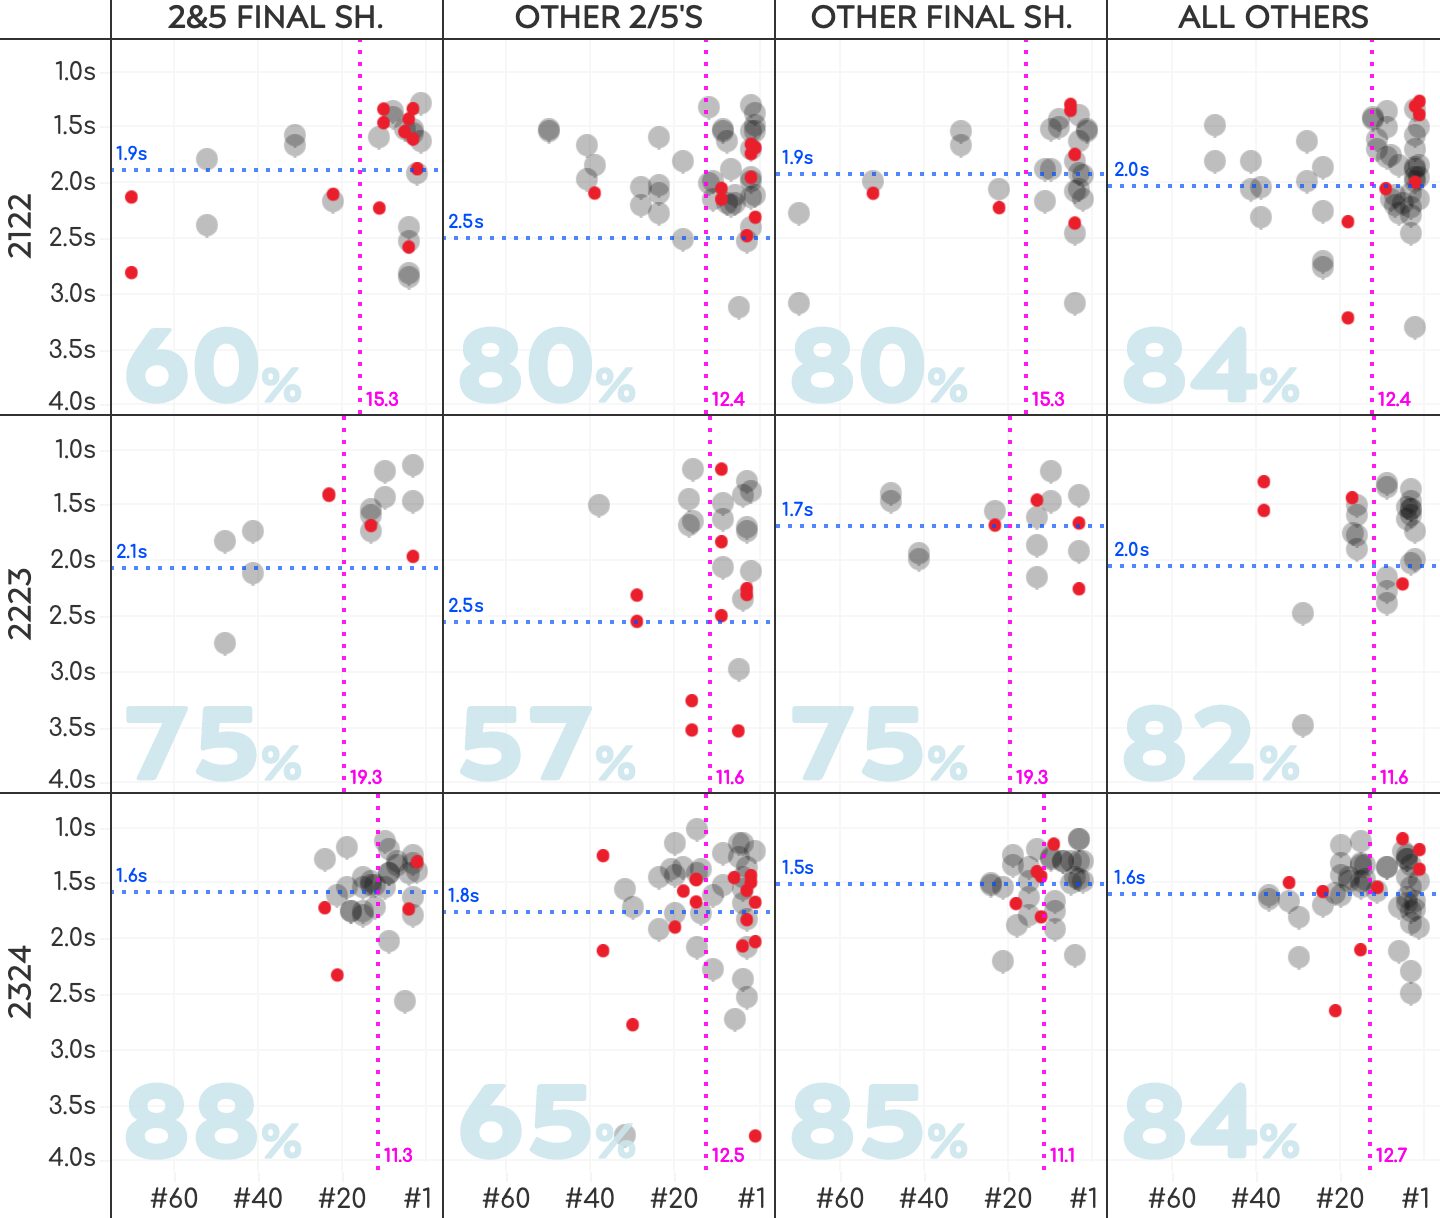
Looking left to right we see that he may have fixed the problem of shots two and five in the final shooting, but in the other standing shots two and five the hit rate is still low. If pressure is a factor it almost seems he feels more of it in the first standing shooting than the final shooting. The other shots in the final shooting are also strong, as are shots three and four in the non-final shooting. If you look at the average shot times he proves aging that shooting faster actually gives him better results. Where the average shot time is 1.5 or 1.6, his hit rate is above 83%, but the non-final two’s and fives on average are a bit slower. And as we found earlier in the analysis: the shot time spread, or variance is much higher for non-final two’s and fives than the other three groups. We already learned that shooting around his season average consistently gives him better results.
What stands out for the final shots two and five in 23-24 is that he shot faster and under more rank-based pressure than previous seasons. And, in my opnion the most important factor, he shot very consistently around his averages with little variance compared to previous seasons. Leading to very positive results!