
Getting pumped for the new Biathlon season?
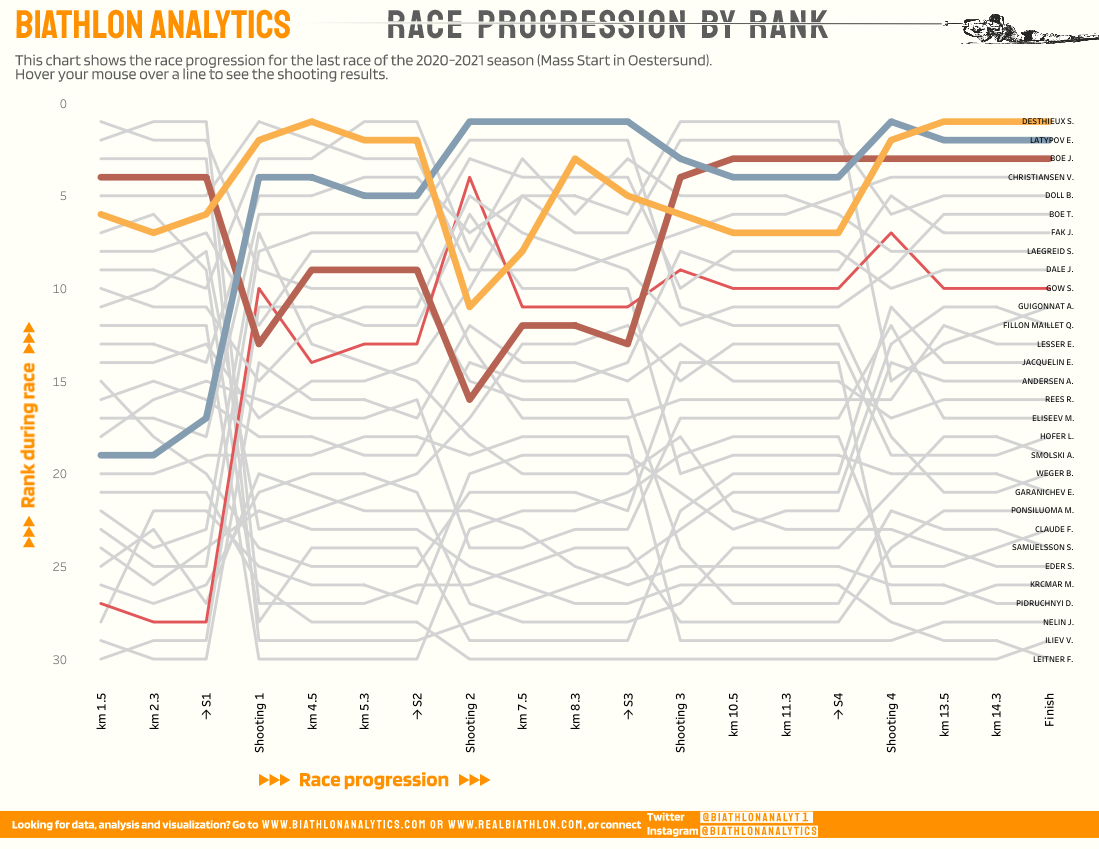
A quick re-run of the last race of last season, by ranking
A quick re-run of the last race of last season, by ranking
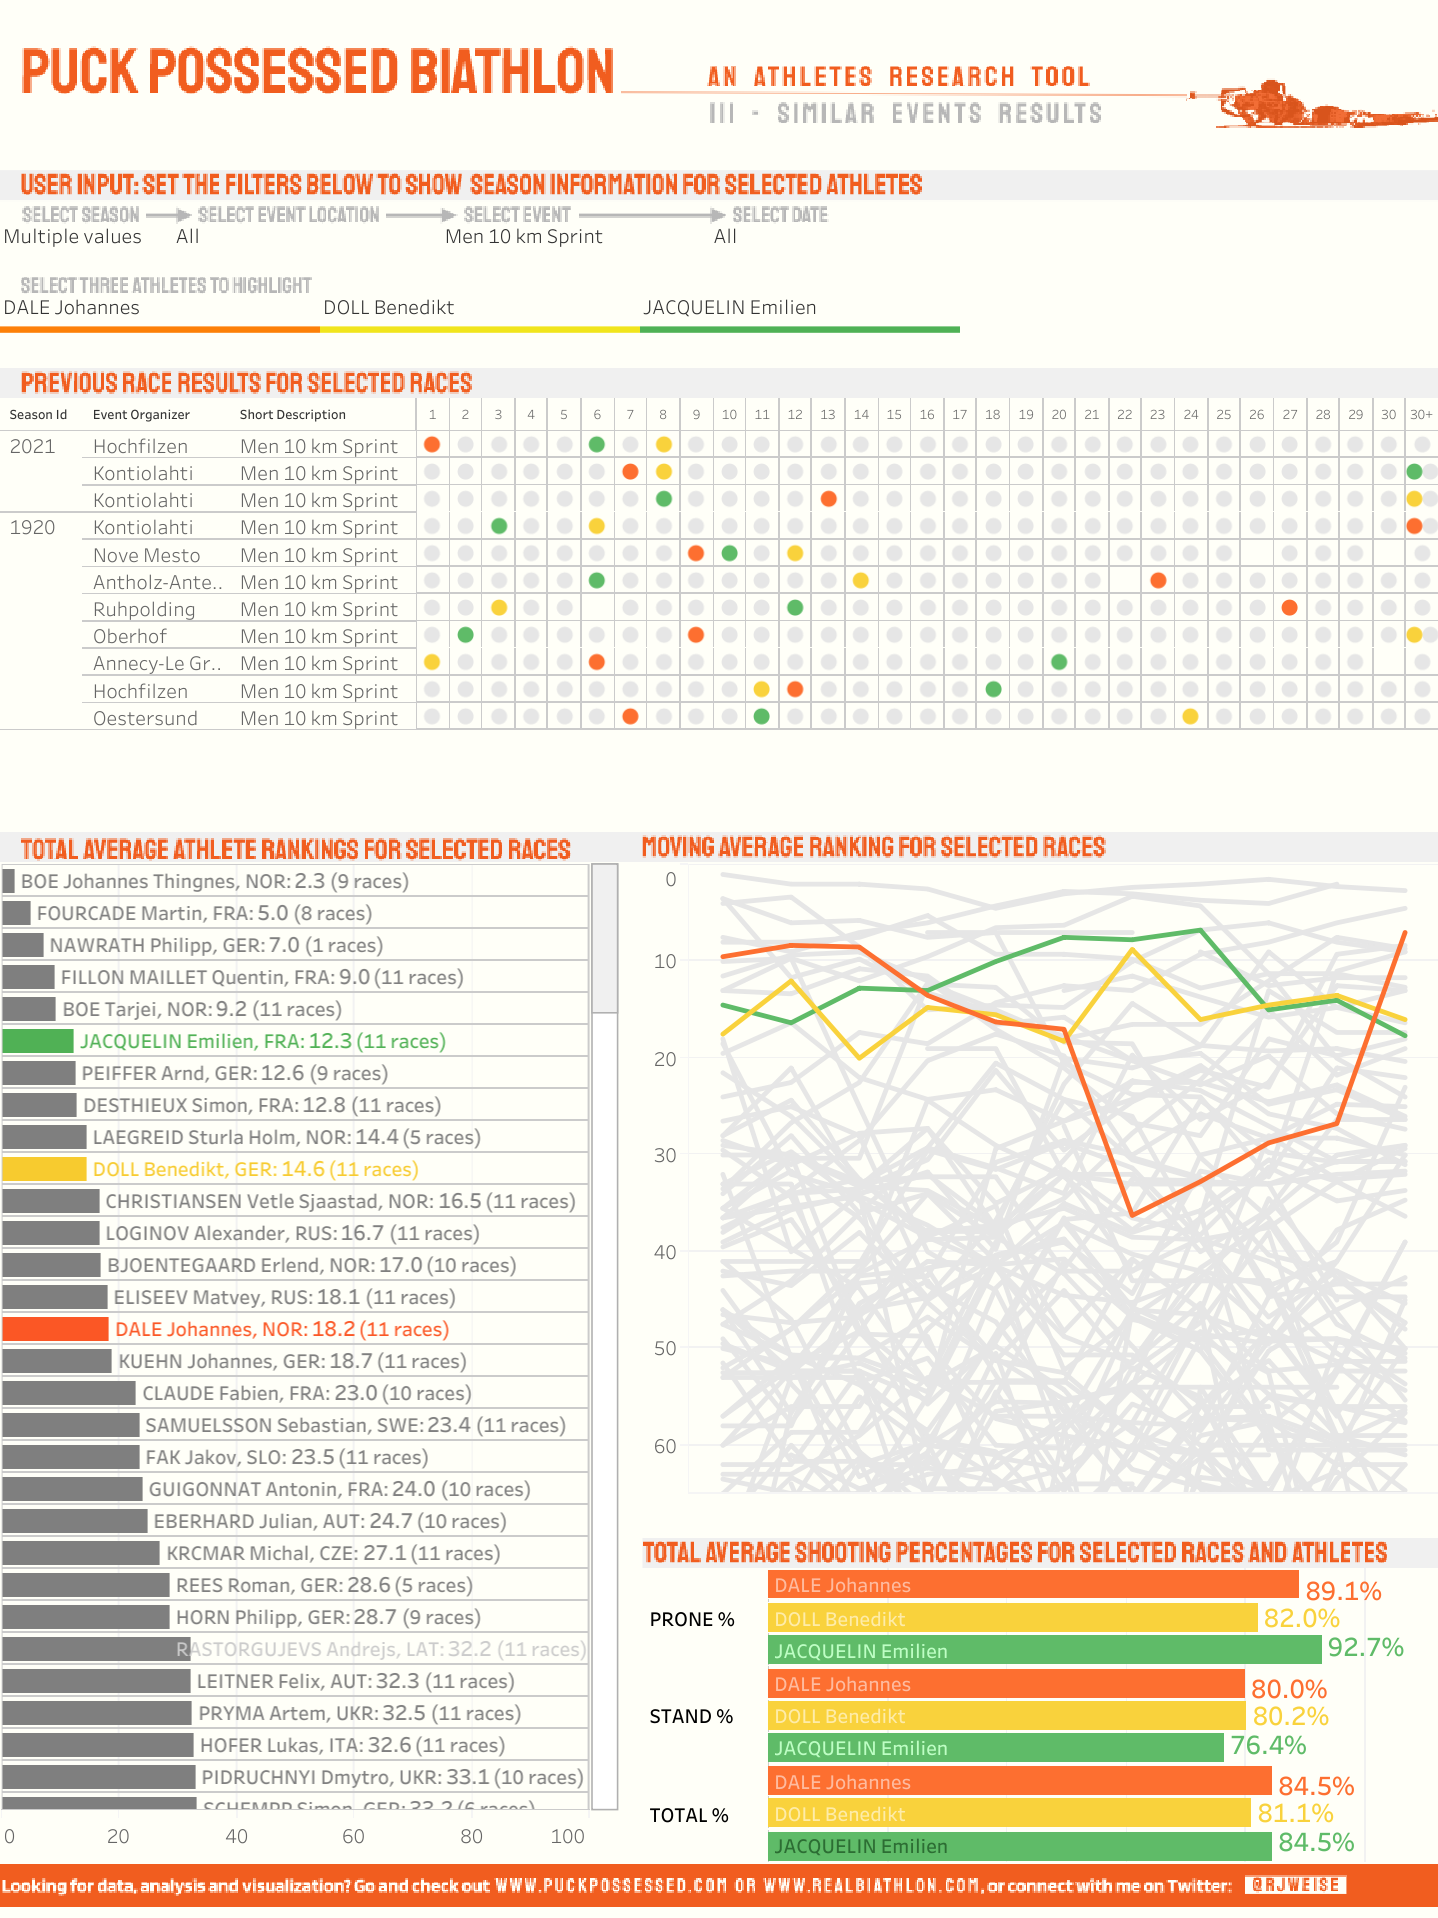
This blogpost shows how to load data from a real biathlon Patreon data subscription into Tableau and make dashboards that help you pick the next winners for biathlon fantasy pools.
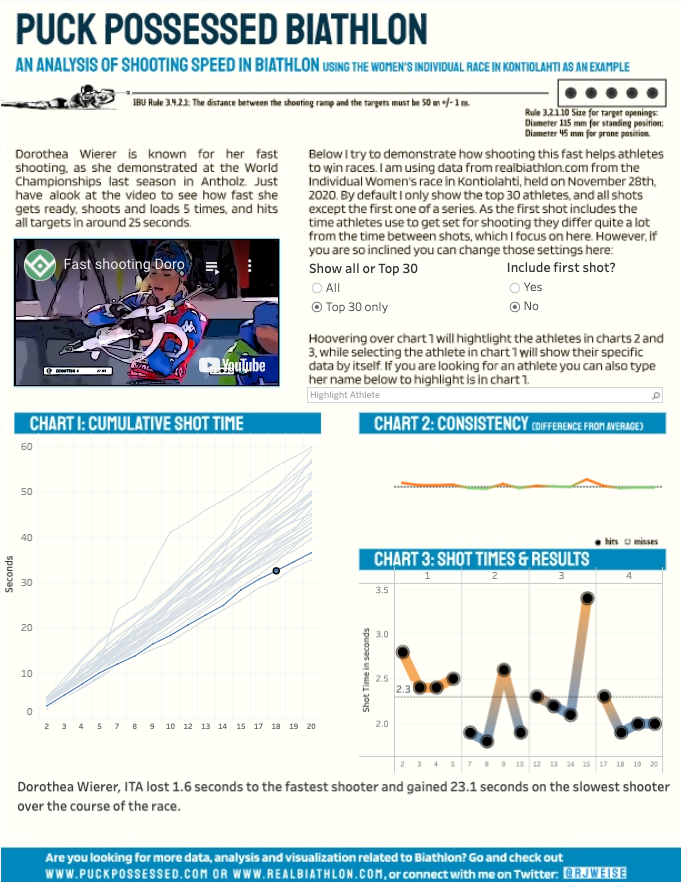
An analysis of shooting speed in biathlon, using the women’s individual race in Kontiolahti as an example.
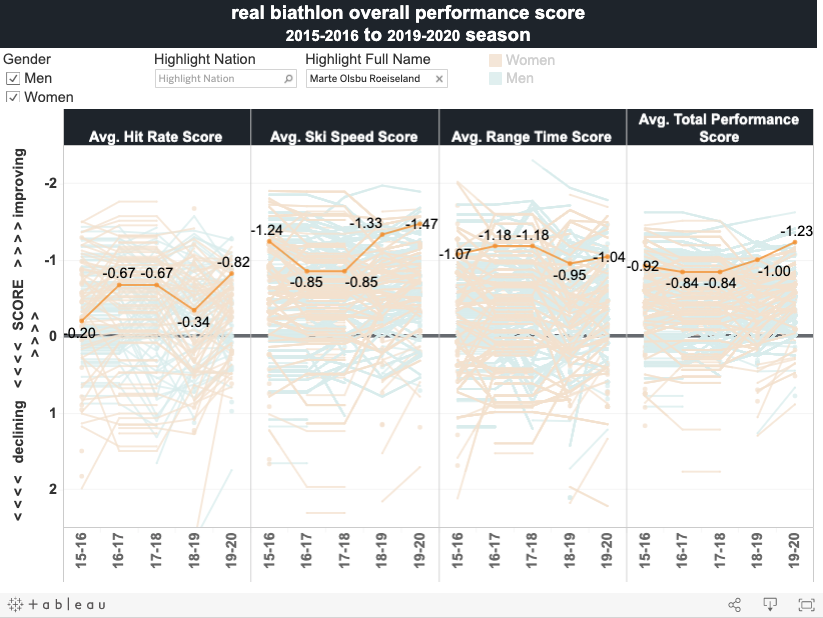
A step-by-step on how to make a quick interactive chart based on data from the real biathlon website
After I worked with R in the past and starting playing around with R Studio Cloud recently, I thought it would be a good idea to actually read some books about it. And, as this specific book suggested, make some notes and follow examples in a Markdown Notebook, that can be easily published as an html-file. And low and behold, I can just save that file and upload it here, so that I just need to click once and see the same document. Very cool! So, one book I read through is Data Visualization, a practical introduction, by Kieran Healy.… Read More »Learning R – reading books