
Shooting Speed
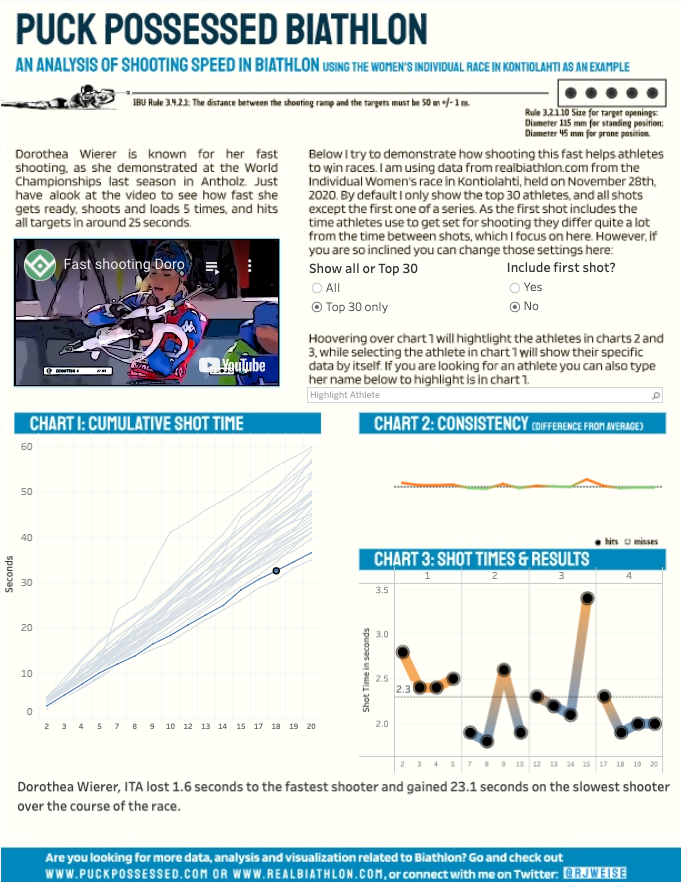
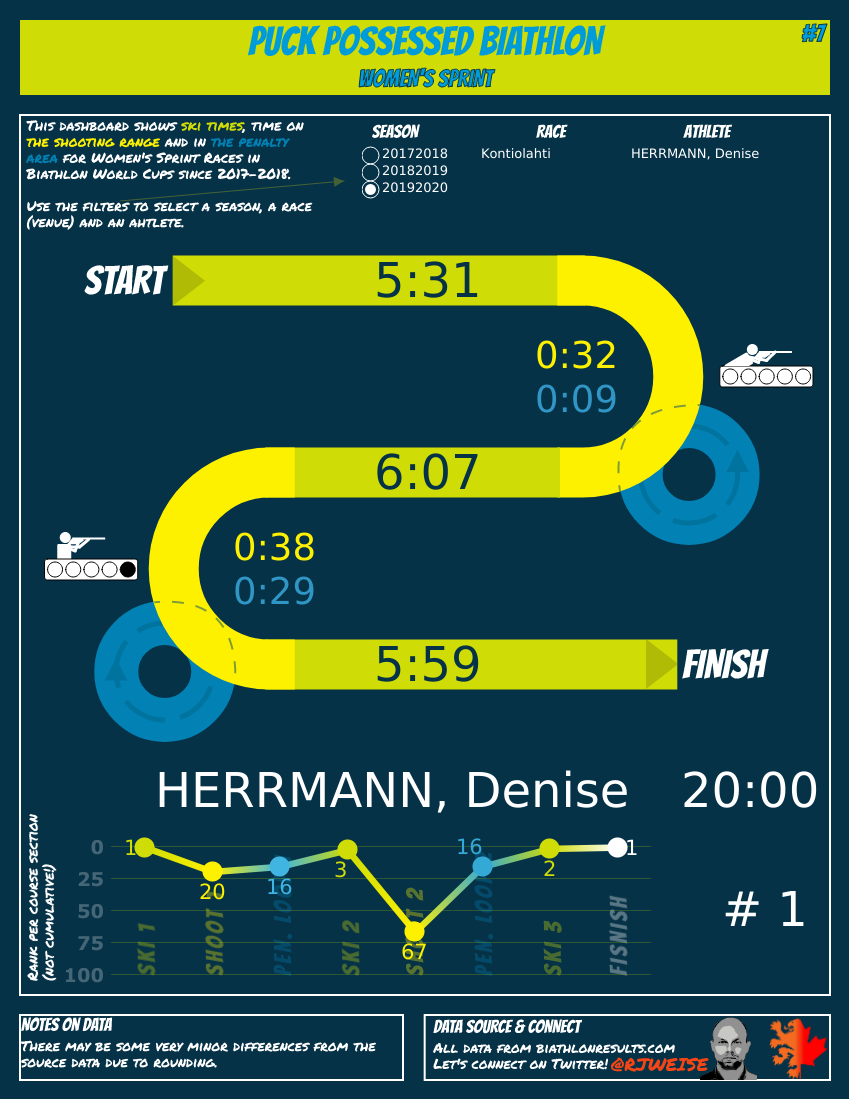
An analysis of shooting speed in biathlon, using the women’s individual race in Kontiolahti as an example.
An analysis of shooting speed in biathlon, using the women’s individual race in Kontiolahti as an example.
A step-by-step on how to make a quick interactive chart based on data from the real biathlon website
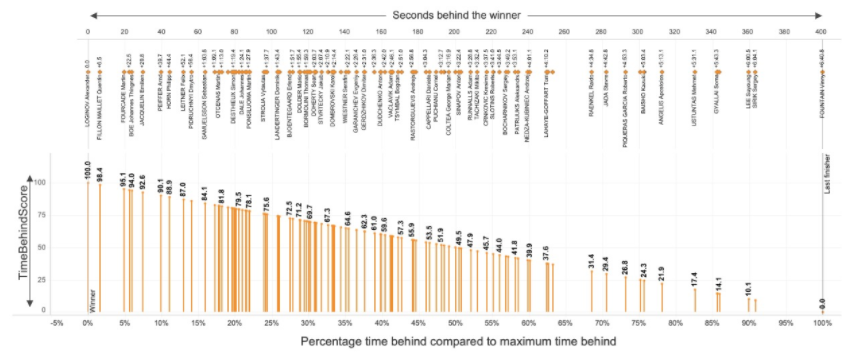
The Time Behind Score is based on the idea that at every level, every athlete is trying to be the fastest and wants to avoid being the last athlete crossing the finish line. It also can be used to compare race results between different seasons and levels.
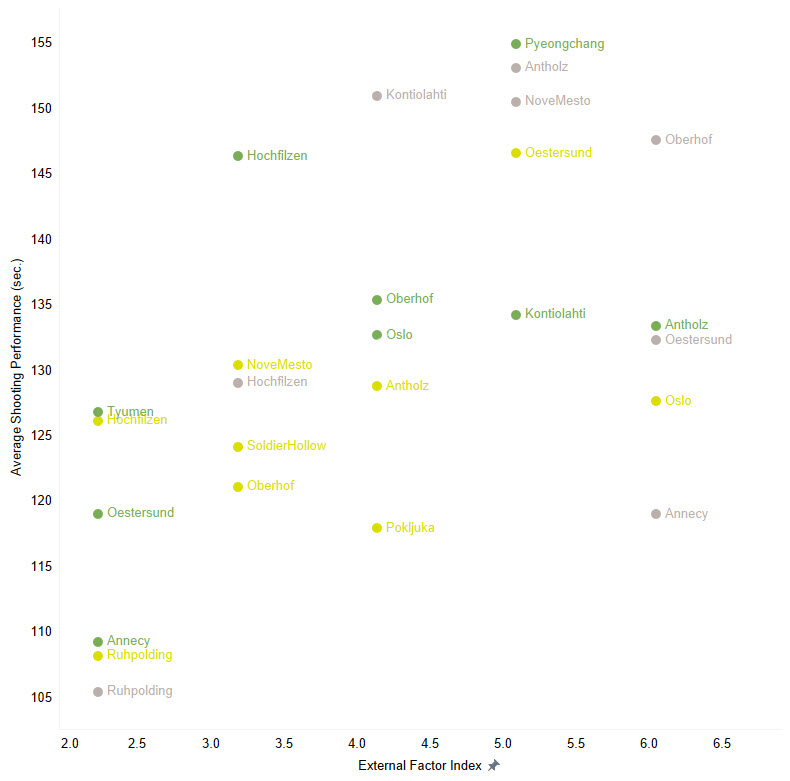
I want to look at the influence of things like weather and snow conditions, as well as course information, on the shooting performance of biathlon athletes.

Researching which athlete had the best results for Pursuit Races strictly looking at the actual race time, what is the largest difference between the actual rankpoints and total rankpoints, and which athlete made up the most positions?
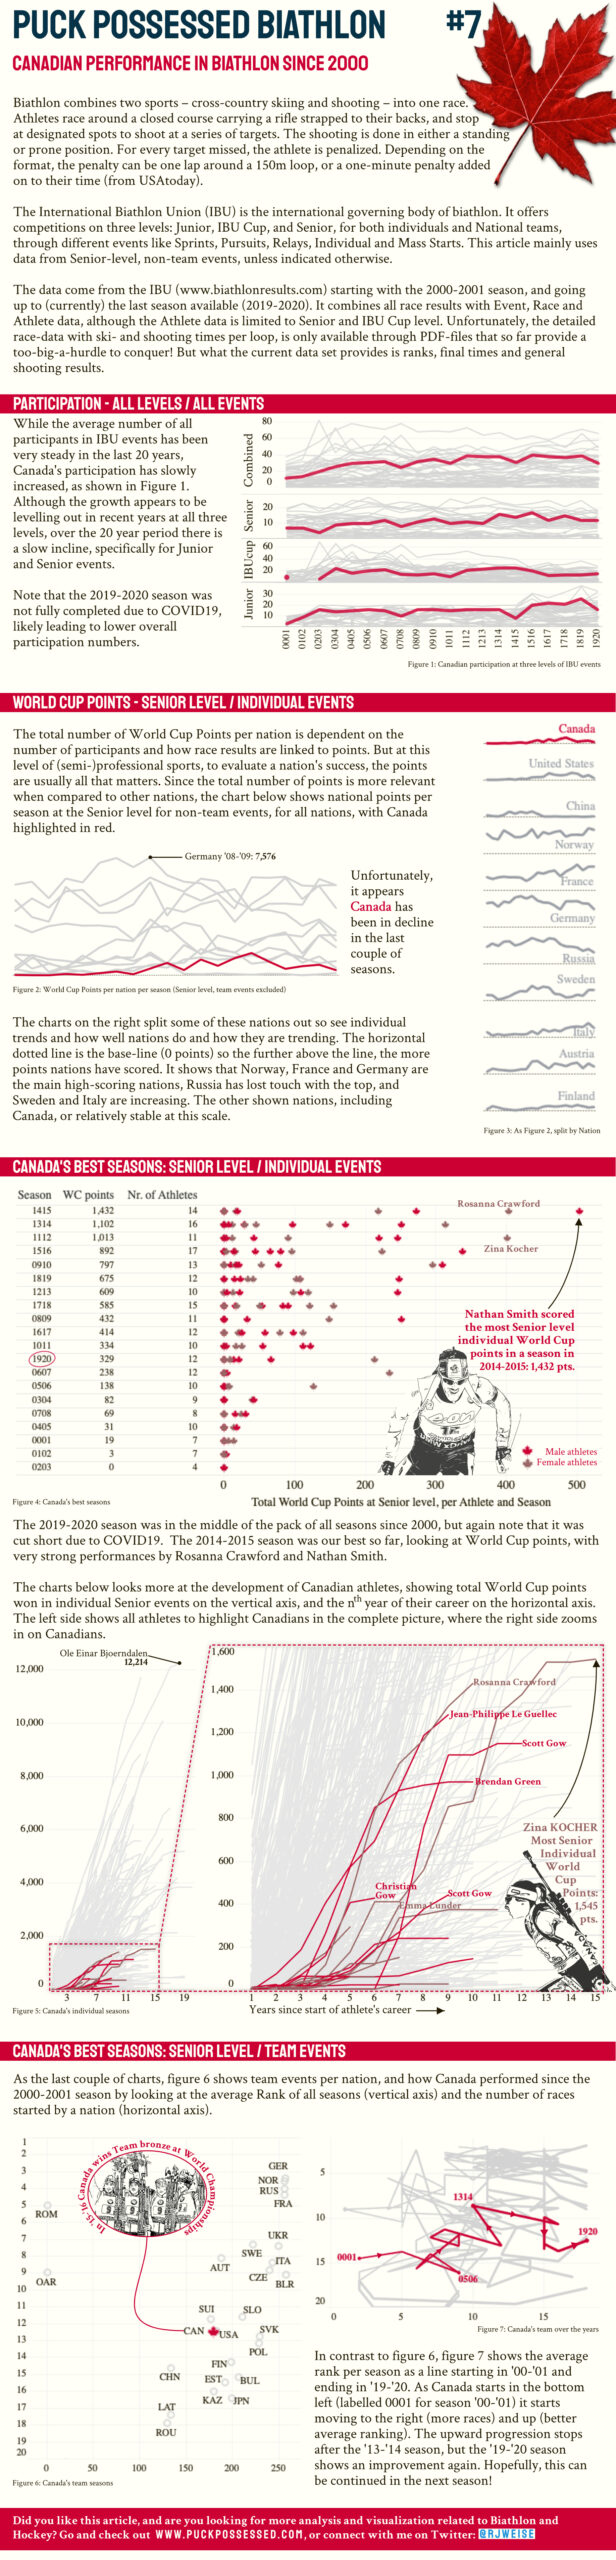
I reviewed the IBU Biathlon data for Canadian performances since the 2000-2001 season and wrote an article. To see the full quality file, download the PDF below. The preview below that is low quality to keep the file a decent size and give an idea what the file looks like. I hope you enjoy.
Looking at Canadian performances in biathlon since the year 2000
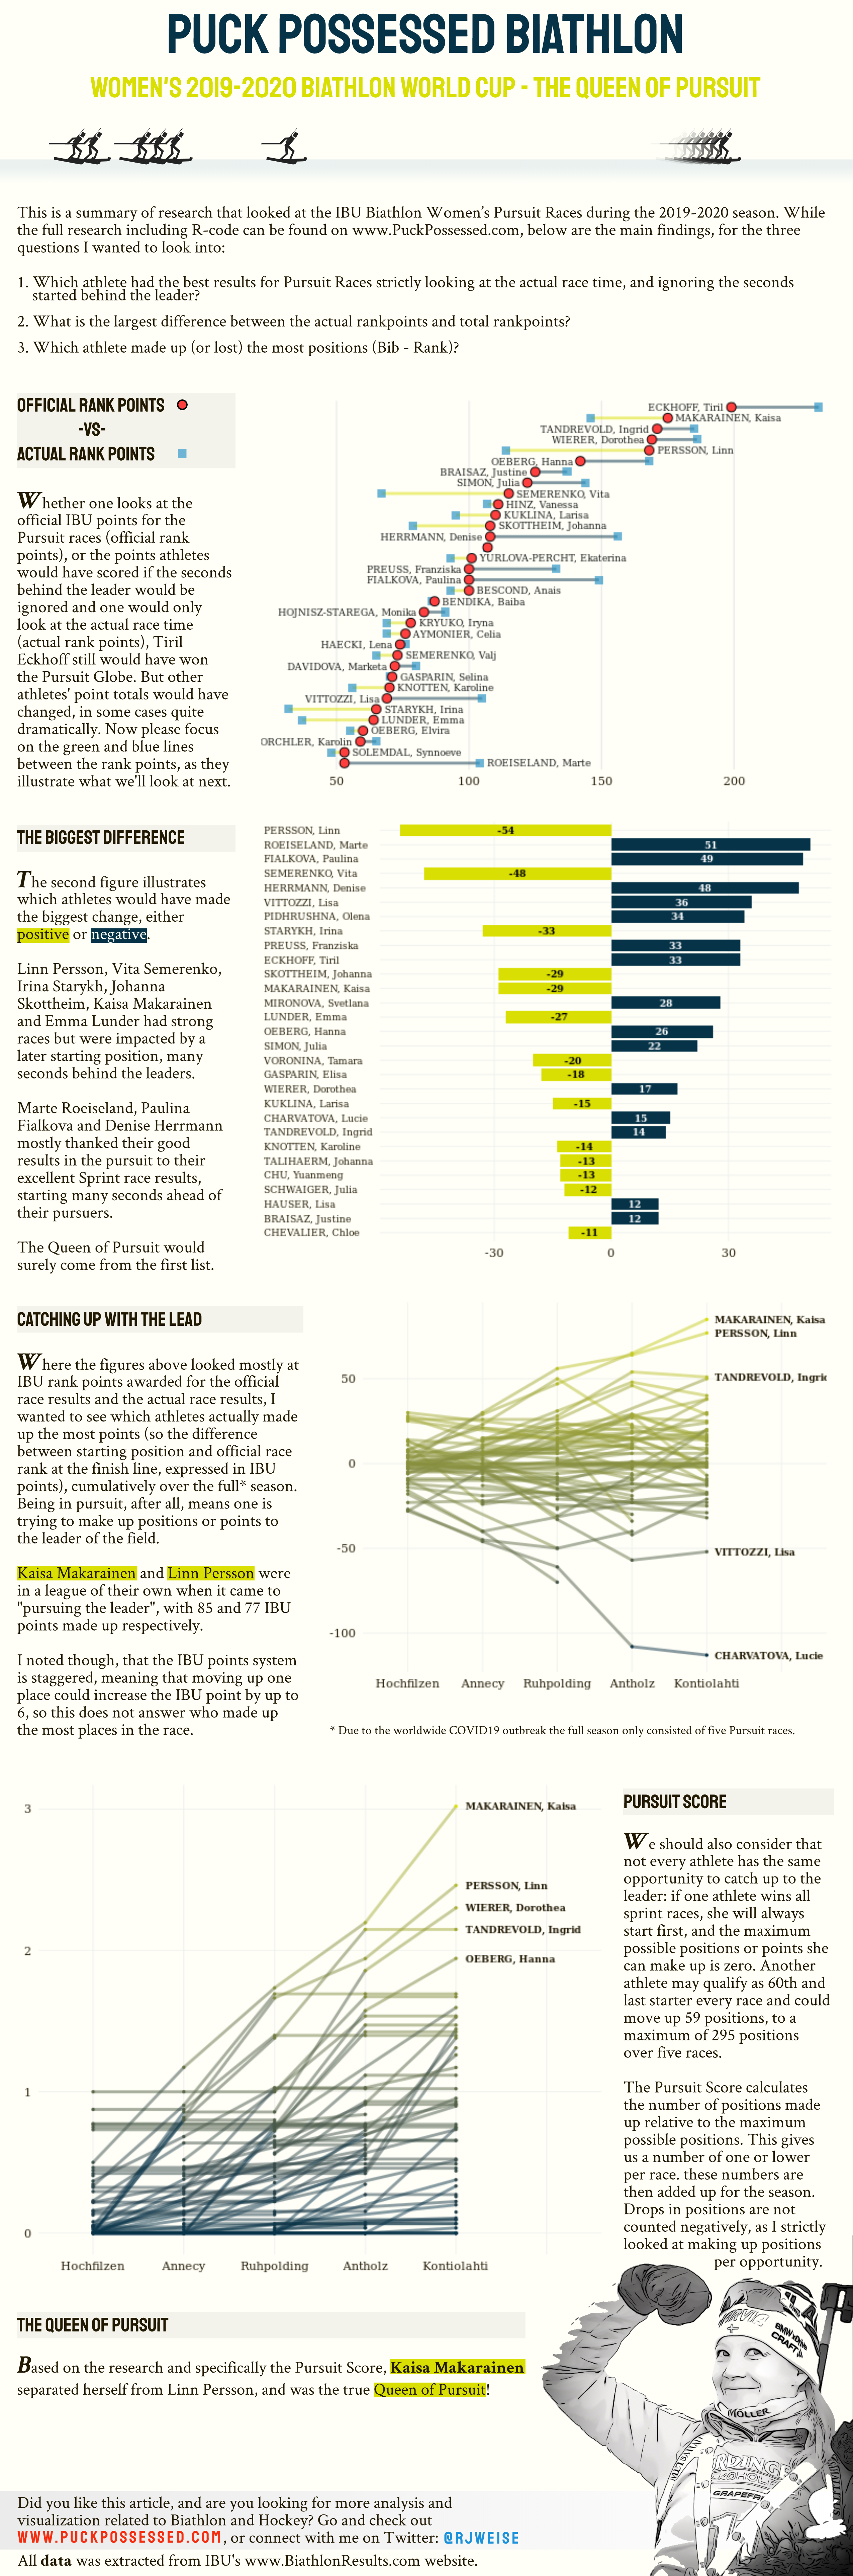
As I’m really liking working in R-Studio, I did my next research in R as well: the Queen of the Pursuit. Unfortunately I am limited to only one season’s data, and a limited season as well. But, as the Dutch saying goes, sometimes you’ve got to row with the oars you got. The full research and R-code can be found on this separate page, and I used another tool I’m quite fond of, Gravit Designer, to create a final result of the research: Here’s the R Notebook including all the code and visuals: I hope you enjoy. Any comments or… Read More »PuckPossessed Biathlon #6 The Queen of Pursuit
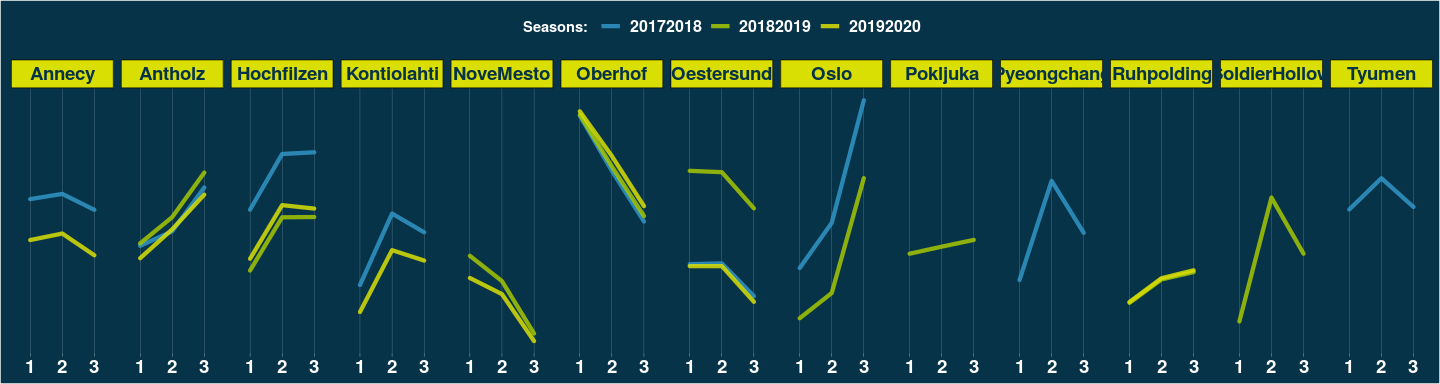
Looking at the Course Times per Race and Season, I noticed some strong differences in what laps are faster and slower: For example, Oslo starts fast (the course times are shown in seconds, so the lower the value, the faster the ski) but ends really slow, with a significance time difference. Oberhof on the other hand gets faster as the race goes on. Initially I wondered if these trends were influenced by tactics based on weather conditions, but looking a the chart above it is clear the the trends are strongly dependent on the location / stadium / course. I… Read More »Biathlon Course Time Strategy
After I worked with R in the past and starting playing around with R Studio Cloud recently, I thought it would be a good idea to actually read some books about it. And, as this specific book suggested, make some notes and follow examples in a Markdown Notebook, that can be easily published as an html-file. And low and behold, I can just save that file and upload it here, so that I just need to click once and see the same document. Very cool! So, one book I read through is Data Visualization, a practical introduction, by Kieran Healy.… Read More »Learning R – reading books
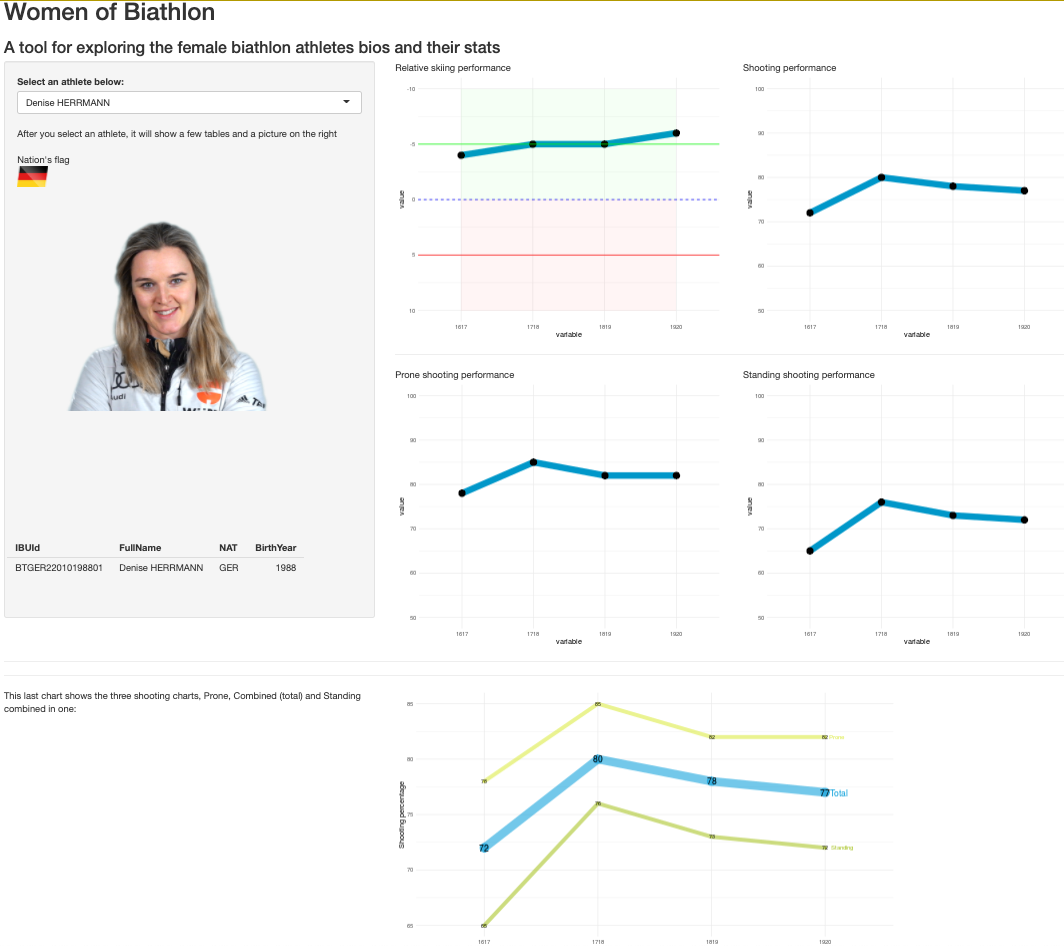
For the 5th issue of the Puck Possessed Biathlon series I decided not to use Tableau, but rather give R, R-Studio, Shiny and the ggplot2 package a go. It had been a while that I last used R, but after a few days of struggling, I think I got the basic principles back under control. Well, sort of. First I wrote a script that pulled data from the Biathlon API, for all women that participated in the IBU sprint world cups in the 2019-2020 season. More detailed writing on that process can be found here, while the code is in… Read More »Puck Possessed Biathlon #5
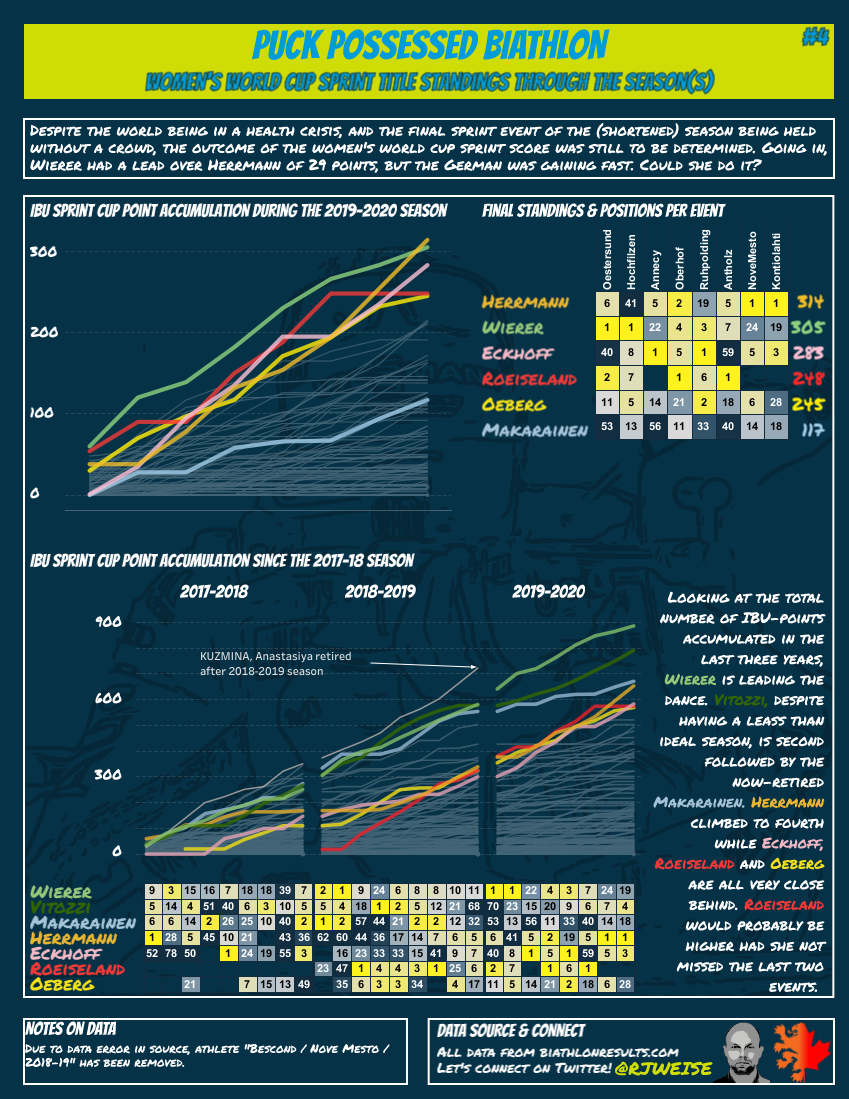
I made a Tableau report on the progress of the Women’s Sprint standing for the 2019-2020 season, with its climax at the last race in Kontiolahti, where Denise Herrmann was able to just get ahead of Doro Wierer for the Sprint Title! I also looked at the last three seasons to see who got the most cumulative points. The report itself can be found on my Tableau Public account, just look for PPB-4 Biathlon Women Sprint – IBU Points (direct link).
In the third issue of Puck Possessed Biathlon, I want to look at the influence of things like weather and snow conditions, as well as course information. This is all summarized in reports made available on the https://biathlonresults.com/ website as Final Results – Competition Data Summary: From this report, I used the measurements provided, except for the measurement taken half an hour before the race, as it doesn’t seem that relevant. Also, all these measurements should be taken with a grain of salt (how accurately are they measured, it’s only on one measure location, and some “measurements” are qualitative. In… Read More »Puck Possessed Biathlon #3
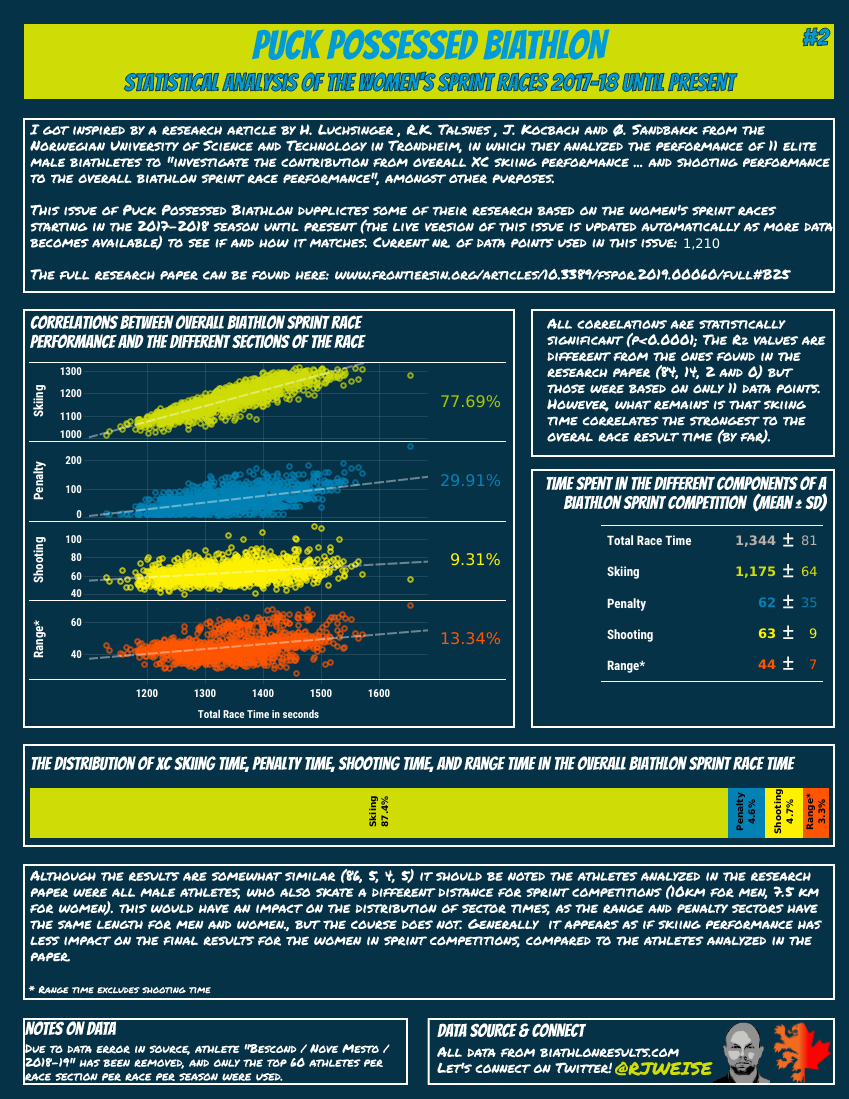
Analyzing the correlations between overall biathlon sprint race performance and the different sections of the race
Alright, finally my first Puck Possessed using Biathlon data. If you are in any way familiar with Biathlon data from the IBU Datacenter you know the pain you have to go through from seeing the data in their great tool to getting it into a data visualization tool like Tableau. So far I have been able to get data for all Women’s Sprint events for seasons 2017-18, 2018-19 and the current season. Although I’m happy that the IBU puts this data out there, it’s unfortunate they don’t do so in a way that would be more user friendly to use… Read More »Puck Possessed Biathlon #1
A page on Canada’s Open Data Portal got me interested in the Fur Trade in (and around) what we now call Canada. (link) It also contains a map that uses colour, symbology and labels to identify Fur Trade posts based on who was the first owner, when it was started, how long it was active, etc. It’s a great map, and I quote from the site: “Contained within the 4th Edition (1974) of the Atlas of Canada is a map that shows locations of fur trading posts for the period 1600 to 1870.“ When I saw this map I really… Read More »Posts of the Canadian Fur Trade
Puck Possessed Issue 9: shot attempts and scoring chances In issue 2 I talked a bit about shot attempts, but the current issue goes deeper, and also looks at, and explains, scoring chances. The first page of the issue is about shot quality and quality. Is it better to show often or pick and choose only those locations that have a higher statistical chance of scoring? A table compares how teams rank for both shot attempts (abbreviated as SA, not to be confused with shots against) and Goals as a ratio of SAs. These two rankings are then combined, and… Read More »Puck Possessed # 9
National Pride In Canada we tend to call Hockey “our” game. Although possessing something as intangible as the game of hockey, or any sports game for that matter, Puck Possessed issue 8 looks at National Pride in hockey expressed by players in the NHL representing different “nation groups” in the NHL. As looking at all individual nations didn’t make much sense, I combined Sweden and Finland, all former Soviet states, and a rest group combining numerous smaller European countries with one-offs like Australia and Bahamas. I should also note that these are based on the Nationalities listed on the NHL web page; I… Read More »Puck Possessed #8
Power play success expressed through the time it takes to score a PP goal Power play success is typically shown as a percentage: number of power play goals as a percentage of the number of power play opportunities. Nothing wrong with that. But I was curious to see how long a team typically takes to score during the 120 seconds of power play. Yeah, big caveat; see below in the Data section. And pretty soon I realized it would not be as easy as I initially thought. You’d think I would have figured that out by now… THE DATA I… Read More »Puck Possessed #7
Issue 6 of Puck Possessed looks at Vorecek’s pass into space rather than dumping it.